 BMC Bioinformatics: Multiple Non-Collinear TF-map Alignments of Promoter Regions
Contents
- INTRODUCTION
- MAPPING FUNCTIONS
- MULTIPLE TF-MAP ALIGNMENT ALGORITHMS
- THE HRCZ-SET DATASET
- MULTIPLE TF-MAP ALIGNMENT OF GENOMIC REGIONS
- ACTIN ?-CARDIAC PROMOTER
- MYOGLOBIN PROMOTER
- EVE STRIPE 2 ENHANCER
- COLLAGENASE 3 (MMP13) PROMOTER
- MEME AS MAPPING FUNCTION
- NON-COLLINEAR ALIGNMENTS
- SOFTWARE HOME PAGE
- REFERENCES
| ABSTRACT |
Sequence comparisons are one of the most important computational tools in molecular biology. Sequences are good symbolic representations of biological molecules that encode relevant information about their structure, function and history. From the analysis of several related sequences, biologically significant facts can be inferred. For instance, genomic sequence comparisons are performed in order to identificate genes or regulatory sites across evolutionarily related genomes, as these functional elements tend to exhibit conservational patterns different from those observed in regions that are not functional.
In attempt to allow for multiple sequence comparisons, the basic dynamic programming recurrences introduced in the 1970s to align efficiently two sequences can be naturally extended for k sequences, with an exponential cost. As this cost is unaffordable in practice, many heuristics have appeared to provide acceptable solutions with a minor cost. The most popular of them is the hierarchical or clustering method.
Sequence comparisons have limitations however. Although similar sequences do tend to play similar biological functions, the opposite is not necessarily true. Often similar functions are encoded in higher order sequence elements that are not necessarily conserved at the sequence level. As a result, similar functions are frequently encoded by diverse sequences which are undetectable by conventional sequence alignment methods.
In a previous work, we suggested the existence of regulatory information conserved between related promoters that could not be detected at the sequence level. We initially defined the process of mapping a nucleotide sequence into a sequence in the alphabet of TF symbols (the TF-maps). Then, we developed an efficient algorithm to obtain the global pairwise alignment between two TF-maps. Finally, we showed the TF-map alignments were more accurate than conventional sequence alignment to distinguish pairwise gene co-expression in a collection of microarray results.
In the work described here, we present an efficient implementation of the multiple TF-map alignment based in the progressive alignment paradigm. We have introduced some modifications in the pairwise global TF-map alignment algorithm to align two clusters of TF-maps, eventually allowing non-collinear arrangements of TFBSs in the results without additional cost. Most dynamic programming global alignments rarely cope with the presence of rearrangements observed in the DNA, being only partially identified by combining global and local alignment strategies. This problem is particularly relevant in the case of the regulatory regions, where non-collinear configurations of TFBSs are prone to be conserved. With both improvements, we are able to compute the best multiple TF-map alignment of several promoter regions, being not necessarily collinear.
| MAPPING FUNCTIONS |
We obtain the translation from a sequence of nucleotides into a TF-map by running on the sequence a collection of position weight matrices (PWMs) representing binding motifs for TFs. For each match over a given threshold, we register the positions, the score, and the label of the TF associated to the PWM. We will refer to the resulting map as a Transcription Factor Map (TF-map).
Two different collections of PWMs have been used in this mapping (likelihood form):
- JASPAR 1.0: 111 matrices [JASPAR database]
- JASPAR 1.0 TOP-50: 50 most informative matrices in JASPAR 1.0
This is an example of a PWM:
TBP 1 61 145 152 31 2 16 46 18 309 3 352 0 2 35 4 3 10 2 374 5 354 0 5 30 6 268 0 0 121 7 360 3 10 6 8 222 2 44 121 9 155 44 157 33 10 56 135 150 48 11 83 147 128 31 12 82 127 128 52 13 82 118 128 61 14 68 107 139 75 15 77 101 140 71 |
TBP 1 -0.466 0.399 0.447 -1.143 2 -1.805 -0.749 -1.687 1.156 3 1.286 -5.270 -3.884 -1.022 4 -3.479 -2.275 -3.884 1.347 5 1.292 -5.270 -2.968 -1.176 6 1.014 -5.270 -5.270 0.219 7 1.335 -3.453 -2.249 -2.759 8 0.825 -3.884 -0.793 0.219 9 0.466 -0.793 0.479 -1.081 10 -0.552 0.328 0.433 -0.706 11 -0.158 0.413 0.275 -1.143 12 -0.171 0.267 0.275 -0.626 13 -0.171 0.193 0.275 -0.466 14 -0.358 0.096 0.357 -0.260 15 -0.233 0.038 0.364 -0.315 |
|
|
|
||
Each row in the frequency matrix M corresponds to the observed distribution of nucleotides in this position of the motif after an aligment of real sites was done. Thus, the element M(x,i) in the matrix is the number of cases in which the nucleotide x was observed at position i. The probability or score to observe such fact is obtained with P(x,i) = M(x,i) / M(A,i) + M(C,i) + M(G,i) + M(T,i).
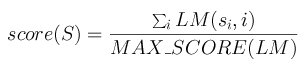
Each element LM(x,i) in the likelihood matrix LM corresponds to the logarithm of the ratio between the probability of observing such a nucleotide in this position in a real site versus the probability of observing it in a false site. False site distribution is modeled with a uniform random distribution (0.25,0.25,0.25,0.25). The maximum score MAX_SCORE of a matrix is the sum of the highest score at each row. The scoring method for a segment S=s1s2...sn with a matrix LM is then:
 |
|
|
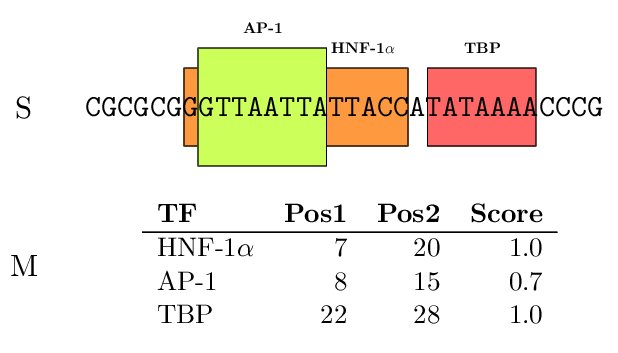
A threshold of 50% was required to accept a prediction of a PWM from JASPAR TOP-50 as a mapping element. This threshold was estimated to produce a similar amount of predictions as a threshold of 80% applied on a conventional frequency matrix. The TFBSs can be graphically displayed as colored boxes corresponding to each TF along the promoter. We have used the program gff2ps to create these graphical representations.
 |
 |
|
|
|
| TF-MAP ALIGNMENT ALGORITHM |
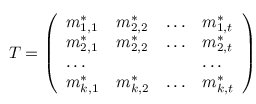
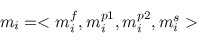
A multiple TF-map alignment --or simply, a multiple map alignment (MMA), in contrast to a multiple sequence alignment (MSA)-- can be formally represented as a rectangular array in which the TF-tuples are aligned into a given column according to their TF label:
There are many possible alignments between a group of TF-maps. The optimal alignment is the one scoring the maximum among all possible alignments. In a previous work (Blanco, Messeguer, Smith and Guigó, 2006), we implemented a dynamic programming algorithm to obtain such an alignment efficiently for the case of two TF-maps. The optimal multiple sequence alignment problem (and therefore also the multiple alignment of maps) is, however, much more difficult, being formally a NP-complete problem.
Here, we propose to adapt the popular progressive alignment strategy to the TF-map alignment. The solutions obtained by this method are not guaranteed to be optimal. However, multiple progressive alignments usually have an underlying biological explanation.
 |
|
|
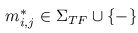
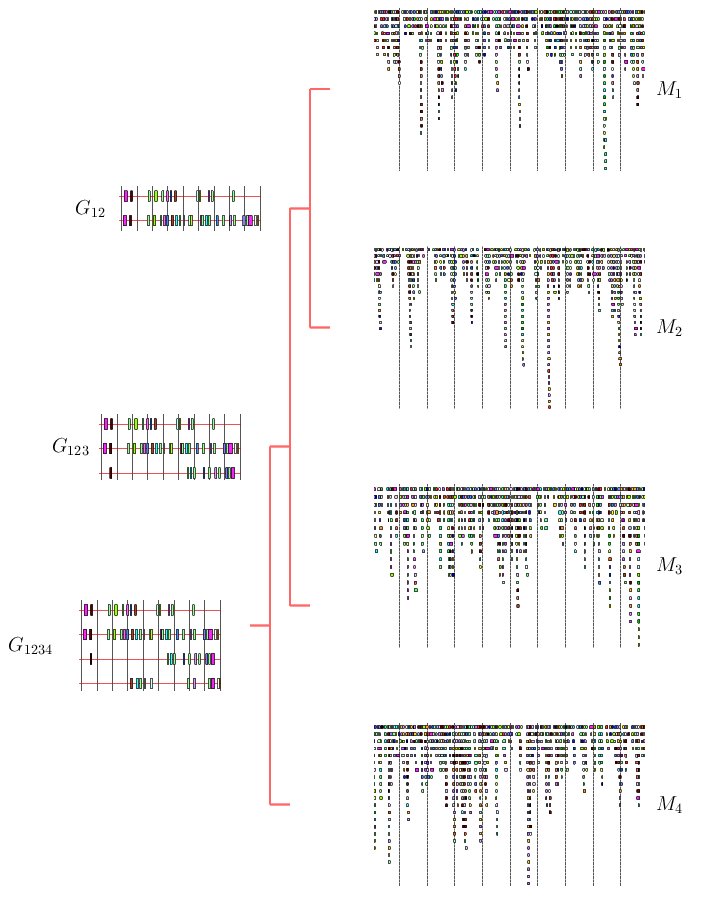
The progressive MMA algorithm shown below builds up a multiple TF-map alignment in a stepwise manner. In a first step, all pairwise TF-map alignment are performed. The initial multiple alignment is created with the two most similar ones. Both maps are substituted for a new group that contains their alignment. The similarity between this new cluster and the rest of the TF-maps is then estimated, updating the similarity matrix.
In a second step, an iterative procedure selects at each round the pair of clusters that are more similar from the pool of available groups. These two groups are aligned and merged again into a new TF-map cluster, estimating the similarity to the remaining ones. At the end of the process, there is only one group that contains the progressive alignment of the input TF-maps.
 |
|
|
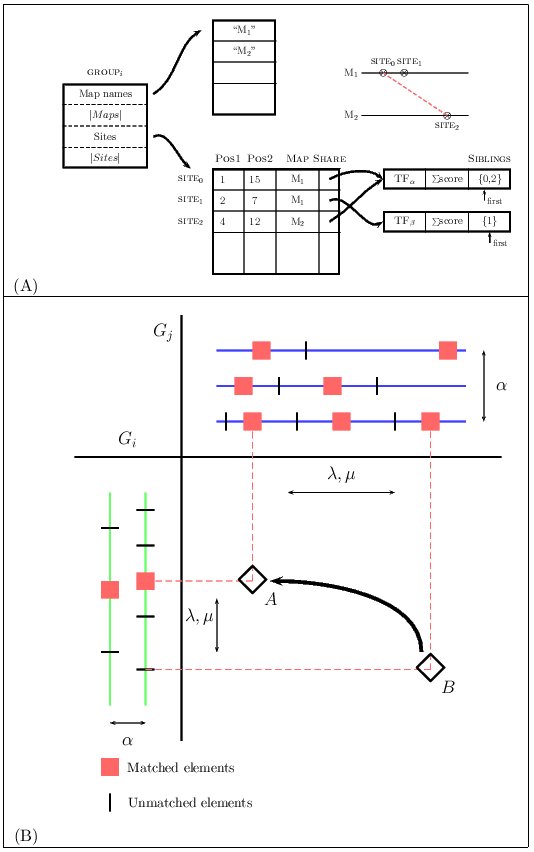
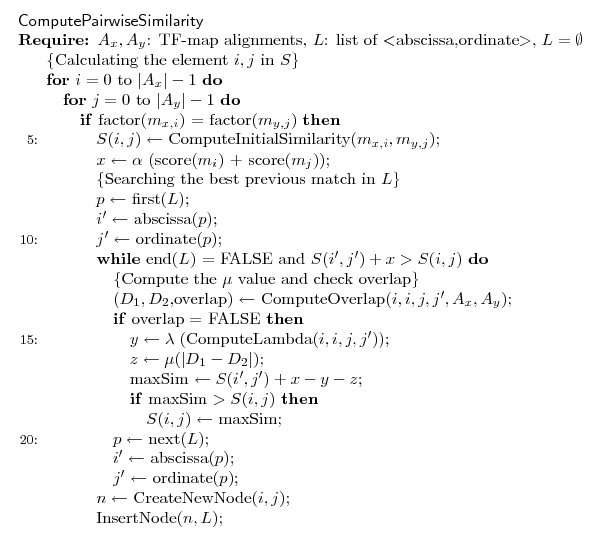
We have adapted the algorithm in (Blanco, Messeguer, Smith and Guigó, 2006), to deal with two groups of TF-maps, maintaining the procedure to fill in the dynamic programming matrix S in the same terms. The algorithm basically searches the array of sites of both groups to find matches between one site in one group and one site in the other. Some additional processing is needed when one of the sites or both are part of a previous alignment in their respective clusters.
We have decided to represent a group of TF-maps as an array of sites, where each site corresponds to an input TFBSs. The sites from different maps that are aligned share a common structure in which pointers to elements that form this match are saved (the so-called siblings list). Gaps here are not represented explicitly. This data structure is a generalization of that implemented for the TF-map pairwise alignment.
 |
|
|
Once a new match is identified, the previous matches must be evaluated in order to construct the optimal alignment ending at this one. Due to the high sparsity of this class of matrices, we substituted a naive implementation that systematically searched all of the cells of S for a list L to register the coordinates in S of the matches computed previously. Thus, to compute the optimal score at the cell S(ij), only the non-empty cells in S that are visible for the current match need to be accessed. In addition, we maintain the list sorted by optimal score, so that the cell scoring the maximum value is at the beginning of the list and, in most cases, only a few nodes will need to be accessed before a critical node is reached beyond which the optimal score can not be improved.
The score of the alignment between two TF-map clusters increases with the score of the matches of the aligned elements (?), and decreases with the number of gaps (?), with the number of unaligned elements (?), and with the difference in the distance between adjacent aligned elements (?).
 |
|
|
| THE HRCZ-SET DATASET |
In a previous paper (Blanco, Messeguer, Smith and Guigó, 2006) we gathered and manually curated a collection of orthologous TFBSs that had been experimentally tested in 36 orthologous human and rodent genes (the HR-set). These functional annotations were incorporated to the ABS database (Blanco et al., 2006).
Here we have extended such a dataset by searching the corresponding orthologs in chicken and zebrafish as well. Using the RefSeq gene set as mapped into the UCSC genome browser, we have correctly identified the ortholog in both species, if available. We refer to the resulting set of human-mouse-chicken-zebrafish homologous genes as the HRCZ-set. This dataset contains 18 human-rodent-chicken-zebrafish orthologs, 7 human-rodent-chicken orthologs, 4 human-rodent-zebrafish orthologs, and 7 human-rodent orthologs.
The HR-set:
- The HR-set (human, mouse)
- The collection of 202 annotated TFBSs
The HRCZ-set:
- The HRCZ-set (human, mouse, chicken, zebrafish)
- The HRCZ-set (info)
- The promoter sequences (200 bps upstream the TSS, FASTA)
- TF-Mapping results (JASPAR-TOP50, GFF)
| MULTIPLE TF-MAP ALIGNMENT OF GENOMIC REGIONS |
The optimal multiple alignment of several TF-maps is obviously dependendant on the ?, ?, ? and ? parameters. Results in a previous work (Blanco, Messeguer, Smith and Guigó, 2006) indicated that TF-map alignments are able to characterize promoter regions of co-regulated genes in absence of sequence similarity. Thus, TF-map alignments were shown to detect high-order regulatory signals conserved in a collection of related promoters that were undetectable for current sequence alignment methods. Here we have conducted a similar systematic training over an extended set of orthologous promoters for obtaining the optimal configuration.
Due to the lack of experimental annotations in chicken and zebrafish, we can not directly evaluate the ability of the multiple TF-map alignment on detecting real binding sites that had been experimentally verified on them. However, we can use another method to show that MMAs are much more informative than primary multiple sequence alignments.
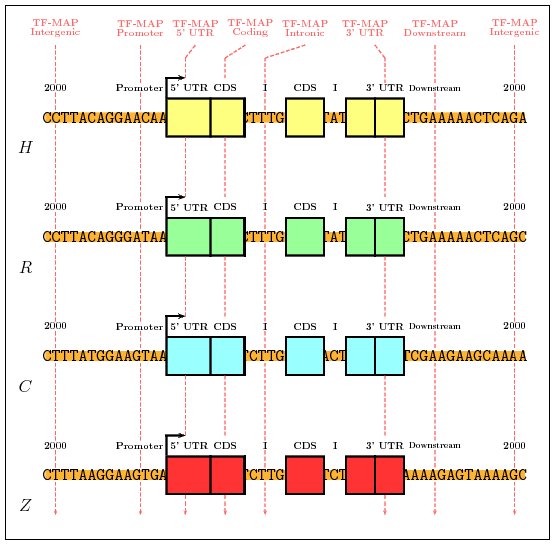
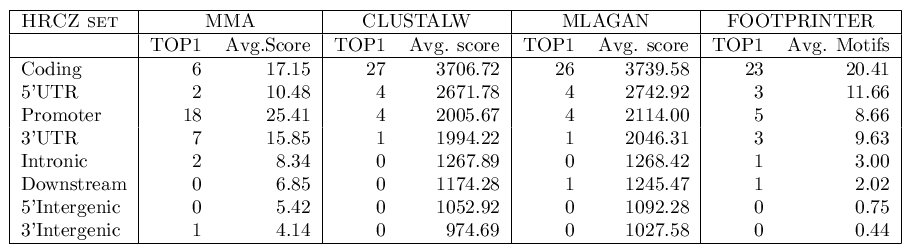
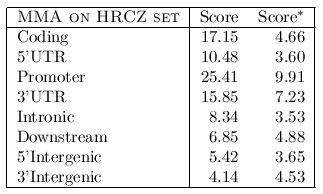
We first have mapped the TFBSs occurrences in the promoter sequences using the collection of 50 most informatives matrices in JASPAR (JASPAR-TOP50). Then, we have compared the MMAs obtained in the 200 nucleotides of the promoter region of the 36 gene pairs from the HRCZ-set, with the MMAs obtained in fragments of 200 nucleotides from intergenic (2000 nucleotides upstream of the TSS), 5'UTR (downstream of the TSS), coding (downstream of the translation start site and considering only coding DNA), intronic (downstream of the first intron junction), and downstream (downstream of the transcription termination site) sequences. We have computed the average score of the MMA in each of the genomic regions and have identified, for each orthologous set, the genome regions in which the alignment produces the highest score. We have performed the same exercise using global multiple sequence alignments (obtained with CLUSTALW).
The HRCZ-set (genomic samples):
- Sequence samples (200 bps, FASTA)
- TF-Mapping results (JASPAR-TOP50, GFF)
- Multiple TF-map training
 |
|
|
We have repeated this test using different combinations of parameters. Systematically, the parameters ?, ? and ? were allowed to independently take values between 0.0 and 1.0, in incremental steps of 0.1. At the same time, the parameter ? (gap penalty) was tested between 0 and -10. The optimal parameter configuration is considered to be that set of parameter values that better discriminate between promoters and the rest of genomic regions [? = 1, ? = 0.3, ? = 0.1, ? =-2].
RESULTS:
- Multiple TF-map optimal configuration
- Sequence alignment results using CLUSTALW
- Sequence alignment results using MLAGAN
- Sequence alignment results using FootPrinter
 |
|
|
We have also shuffled the genes in the HRCZset to produce a set of unrelated genes. Then, we have tested the optimal configuration obtained before on these 36 groups of 2,3 or 4 TF-maps to see if the average score of these TF-map alignments is notably lower than the score in the alignments involving true orthologous gene promoters.
The average score when aligning non-related gene promoters was 9.91.
The average score when aligning orthologous promoters was 25.41.
THE SHUFFLE HRCZ-set:
- The shuffled HRCZ-set (human, mouse, chicken, zebrafish)
- Multiple TF-map optimal configuration results
 |
|
|
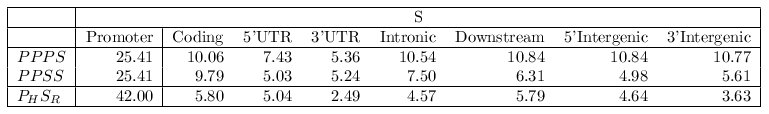
Finally, we have performed an additional test to assess the significance of the scores of the MMAs. The previous tests have involved alignments of orthologous gene regions of the same type (e.g. four promoters or four coding segments). We have compared now the score of the MMAs among orthologous promoters of the same gene in the HRCZ set with the scores of the alignments of the same maps in which one TF-map was randomly substituted by the TF-map of another segment of the same gene (denoted in the table below as PPPS, where P is a promoter map and S is any gene region: Coding, Promoter, Intronic, 5'UTR, 3'UTR, intergenic, downstream).
The average score of MMAs exclusively constituted by promoter maps was 25.41 (PPP + Promoter). Indeed, the average score of the MMAs involving only promoter maps was more than 60% higher than alignments in which one of them was substituted by another gene region map (e.g. 10.06 for PPP + Coding). The average score of such alignments dropped even more when a second substitution was permitted. We analyzed the scores of pairwise TF-map alignments between each human promoter in the HRCZ set (PH) and the corresponding orthologous gene regions (SR) in mouse. The average score of the TF-map alignments involving the two promoters was substantially higher (42.00) than any other incorrect combination (e.g. 5.80 for human promoter-mouse coding region alignments). These results show that orthologous promoter-promoter TF-map alignments are more significant than alignments of any other combination of gene region maps.
The PPPS/PPSS/PS set:
- Results with one substitution (PPPS)
- Results with two substitutions (PPSS)
- Results Human Vs Mouse (PS)
 |
|
|
| ACTIN ?-CARDIAC PROMOTER |
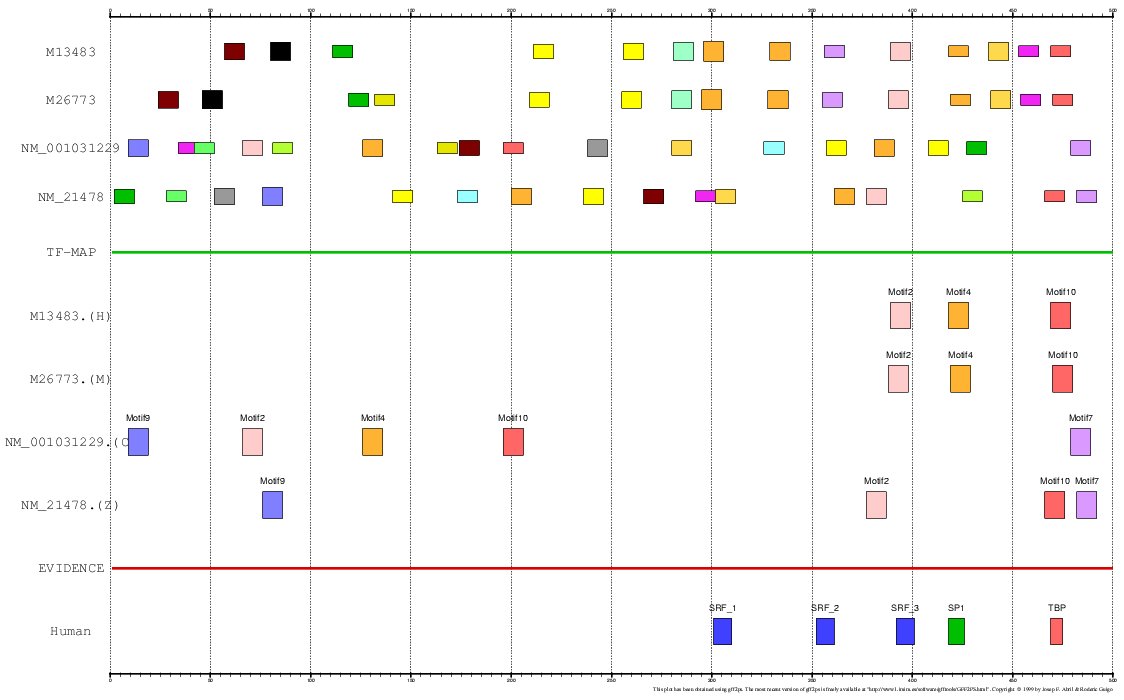
Actins are highly conserved proteins that are involved in various types of cell motility. The alpha actins are found in muscle tissues and are a major constituent of the contractile apparatus. The Actin ?-cardiac gene has been identified in many kinds of cells including muscle, where it is a major constituent of the thin filament, and platelets.
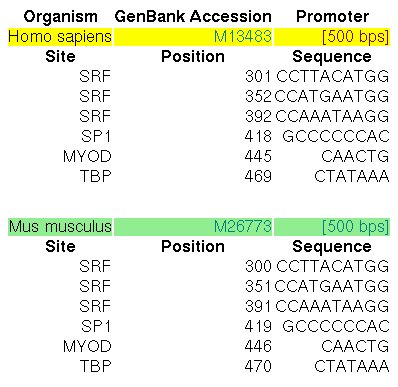
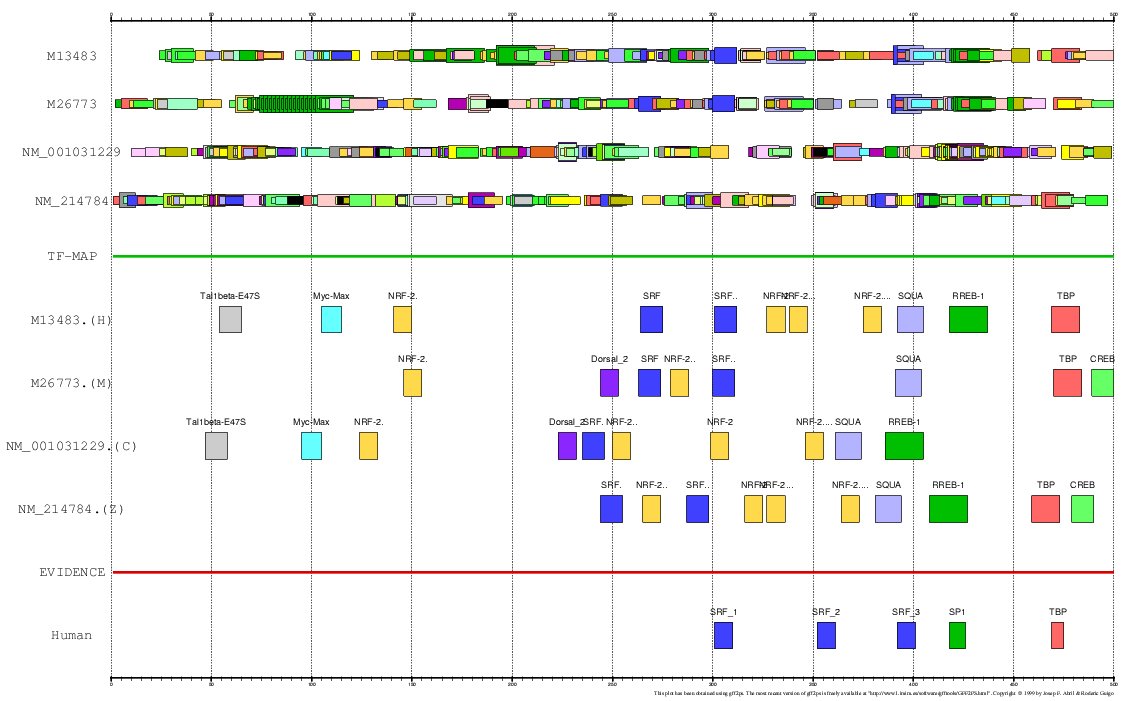
The promoters of the human and mouse Actin ?-cardiac genes (ACTC, GENBANK entries M13483 and M26773) have been extensively characterized by experimental means. In the ABS database, the entry A0028 informs about the known orthologous binding sites in the respective human and mouse promoters (500 nucleotides, the position +501 is the TSS):
 |
|
Figure 12. ABS entry A0028 (Actin ?-cardiac gene promoter) |
PROMOTERS (500 bps, FASTA):
- Human (M13483)
- Mouse (M26773)
- Chicken (NM_001031229)
- Zebrafish (NM_214784)
TF-MAPPING (JASPAR-TOP50):
- Human+Mouse+Chicken+Zebrafish (GFF)
MULTIPLE TF-MAP ALIGNMENT:
- Human+Mouse+Chicken+Zebrafish (GFF)
MULTIPLE SEQUENCE ALIGNMENT:
- CLUSTALW
- MLAGAN
 |
|
|
| MYOGLOBIN PROMOTER |
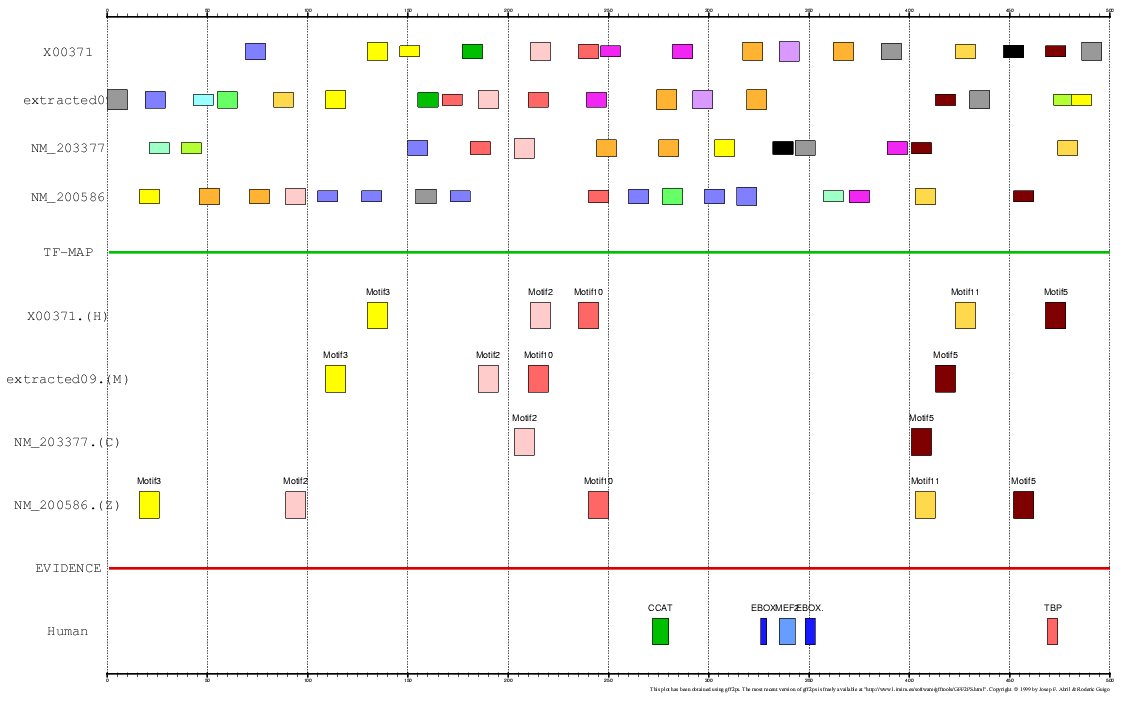
The Myoglobin gene is a member of the globin superfamily and is expressed in skeletal and cardiac muscles. The encoded protein is a haemoprotein contributing to intracellular oxygen storage and transcellular facilitated diffusion of oxygen.
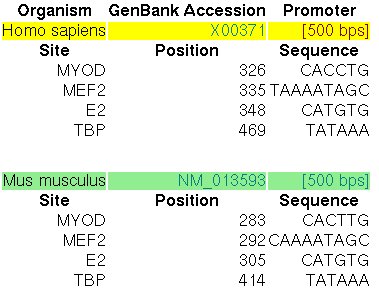
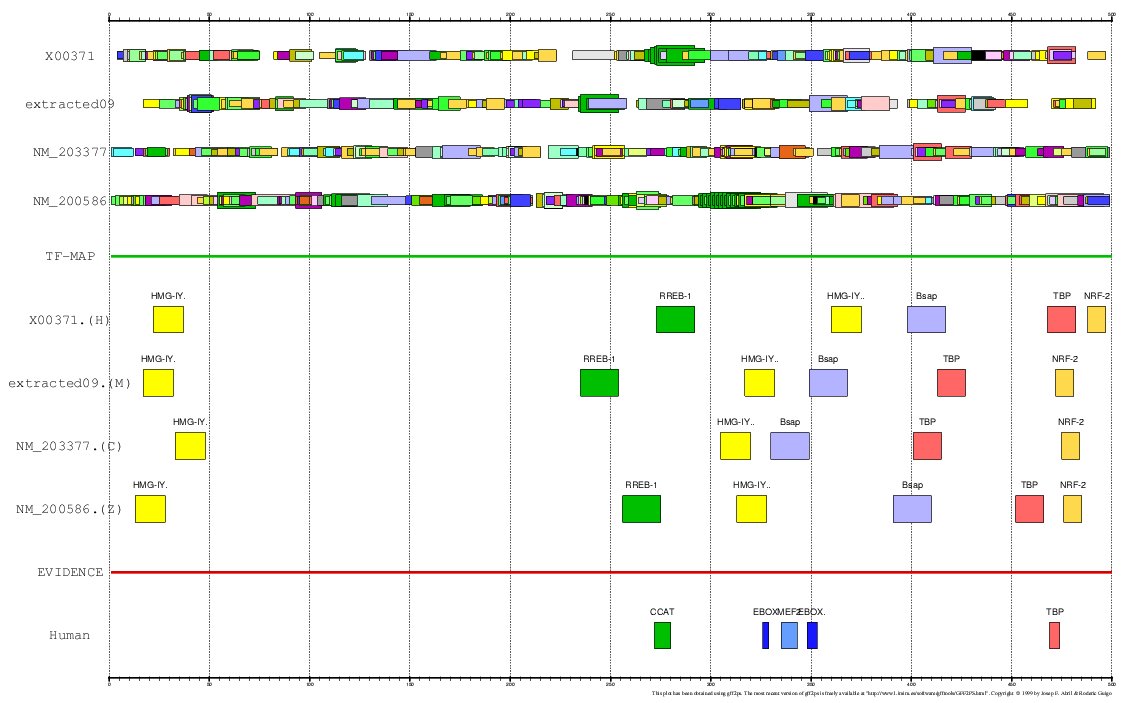
The promoter of the Myoglobin gene in human (MB, GENBANK entry X00371) and in mouse (RefSeq entry NM_013593) have been experimentally characterized. In the ABS database, the entry A0037 informs about the known orthologous binding sites in the respective human and mouse promoters (500 nucleotides, the position +501 is the TSS):
 |
|
|
PROMOTERS (500 bps, FASTA):
- Human (X00371)
- Mouse (NM_013593)
- Chicken (NM_203377)
- Zebrafish (NM_200586)
TF-MAPPING (JASPAR-TOP50):
- Human+Mouse+Chicken+Zebrafish (GFF)
MULTIPLE TF-MAP ALIGNMENT:
- Human+Mouse+Chicken+Zebrafish (GFF)
MULTIPLE SEQUENCE ALIGNMENT:
- CLUSTALW
- MLAGAN
 |
|
|
| EVE STRIPE 2 ENHANCER |
Proximal promoters are adjacent to the gene. Enhancers, however, are other type of regulatory regions (typically 500 - 1,000 nucleotides long) positioned several kilobases upstream or downstream of the regulated gene. Such elements can function in either orientation, being distance and position independent. The regulatory logic of enhancers is different from the promoters, allowing a great plasticity in the arrangement of the TFBSs (e.g. non-collinearity). Enhancers are constituted of multiple binding sites to recruit four or five different TFs that define space and time specific aspects of gene expression.
The body patterning of early embryo in Drosophila is governed by a hierarchy of maternal and zygotic genes. In particular, maternal and gap gene factors together control pair rule gene expression in 7 alternating stripes, which in turn regulate segment polarity and homeotic gene expression in 14 stripes . The stripe 2 enhancer of the pair-rule gene Even-skipped has been experimentally characterized in several species of Drosophila, showing considerable evolutionary change in the binding site composition and spacing (Ludwig, 1998).
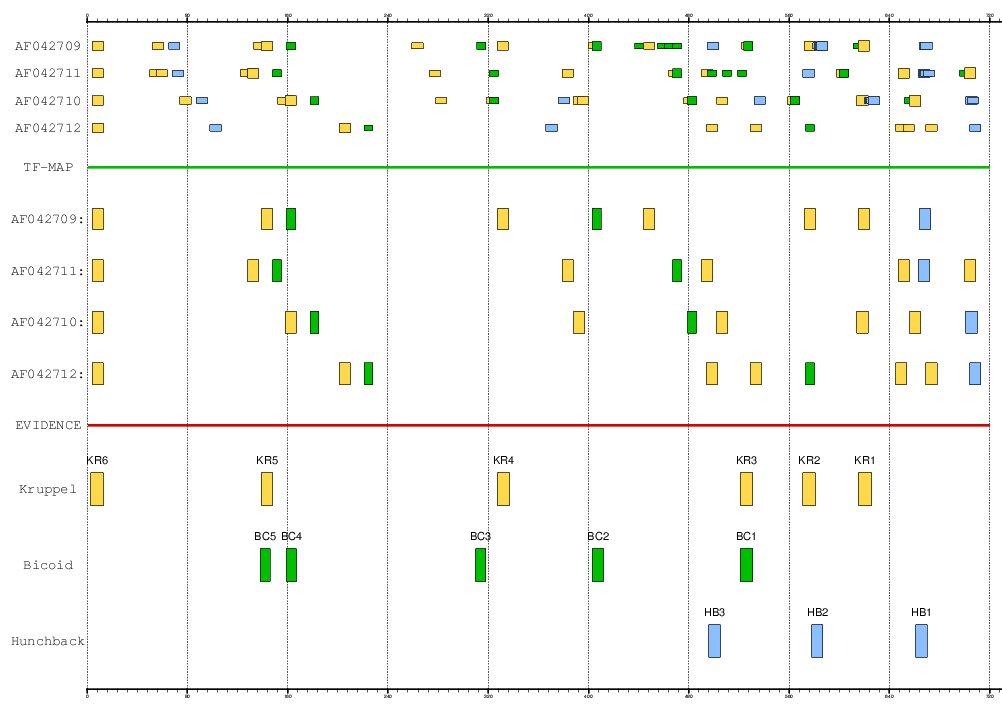
The stripe 2 enhancer of the Even-skipped gene (EVE) is governed by 17 TFBSs of four TFs: 2 activators (bicoid and hunchback) and 2 repressors (giant and Kruppel). The positions of the experimentally verified binding sites in the Drosophila melanogaster enhancer are: bicoid (+138, +159, +310, +403, +521), hunchback (+496, +578, +661) and Kruppel (+3, +139, +327, +521, +571, +615).
PROMOTERS (500 bps, FASTA):
- AF042709 (D. melanogaster)
- AF042710 (D. yakuba)
- AF042711 (D. erecta)
- AF042712 (D. pseudoobscura)
TF-MAPPING (JASPAR-TOP50):
- 102 predictions (GFF)
MULTIPLE TF-MAP ALIGNMENT:
- 9 aligned elements (GFF)
 |
|
|
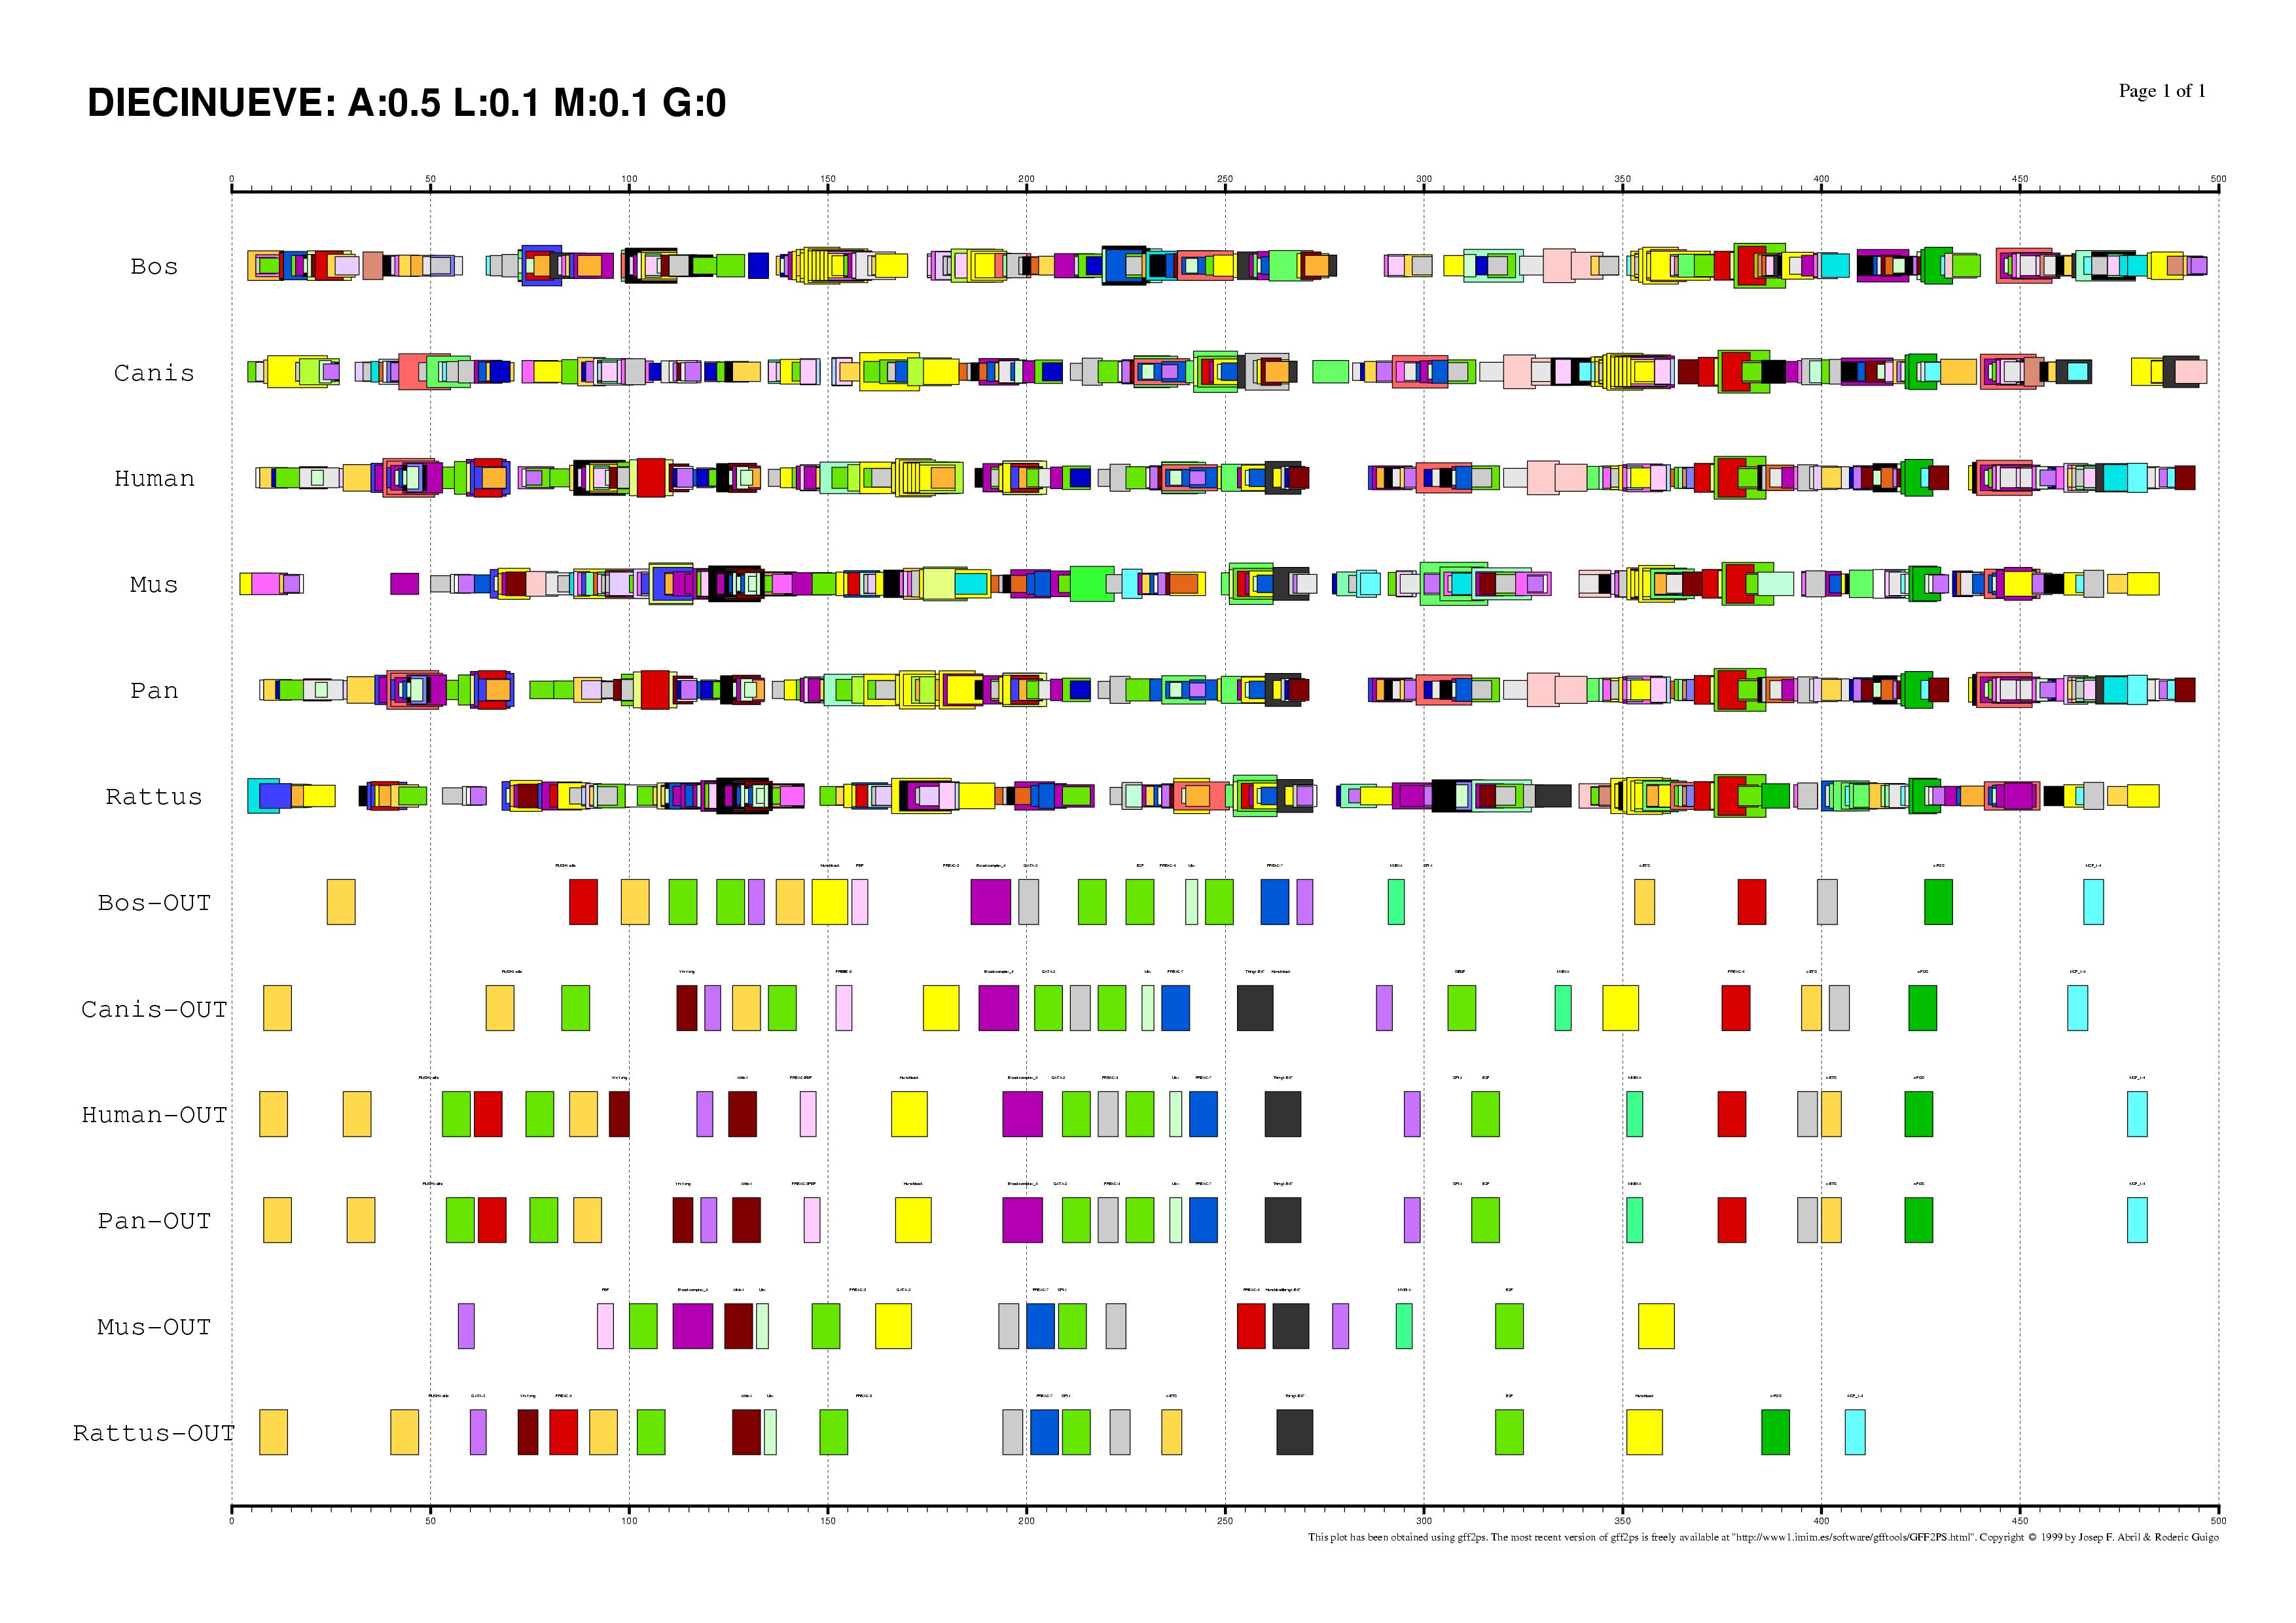
| COLLAGENASE 3 (MMP13) PROMOTER |
The Collagenase-3 (MMP13) gene is a member of the matrix metalloproteinase family. MMP13 plays a major role in normal tissue remodeling processes, being abnormally expressed in breast carcinomas and in cartilage from arthritic patients. Many experimental studies have confirmed the presence of several functional binding sites for known TFs in human and mice.
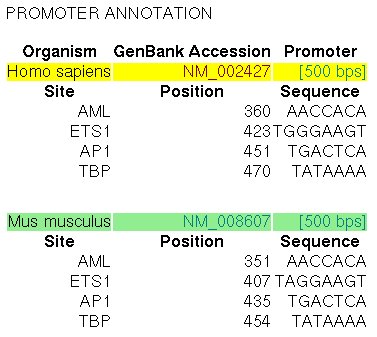
The promoter of the MMP13 gene in human (RefSeq entry NM_002427) and in mouse (RefSeq entry NM_008607) have been experimentally characterized. In the ABS database, the entry A0029 informs about the known orthologous binding sites in the respective human and mouse promoters (500 nucleotides, the position +501 is the TSS):
 |
|
|
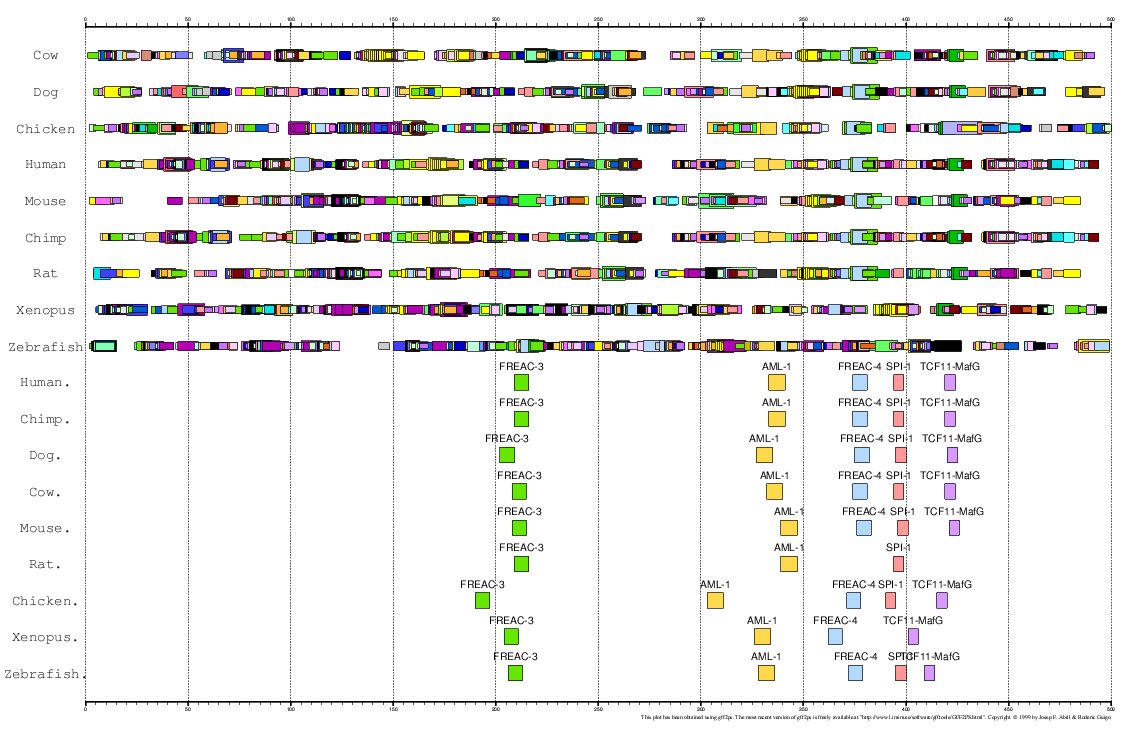
Here, we have analized the proximal promoter regions of MMP13 in human, chimp, mouse, rat, cow, dog, chicken, zebrafish and Xenopus (Ortín et al., personal communication). As the 5'UTR of this gene is very small in most cases, we have considered the region 500 bps immediately upstream the ATG (Translation Start Codon) as the proximal promoter.
PROMOTERS (500 bps, FASTA):
- Human+Chimp+Dog+Cow+Mouse+Rat+Chicken+Xenopus+Zebrafish
TF-MAPPING (JASPAR):
- Human+Chimp+Dog+Cow+Mouse+Rat+Chicken+Xenopus+Zebrafish (GFF)
MULTIPLE TF-MAP ALIGNMENT:
- Human+Chimp+Dog+Cow+Mouse+Rat+Chicken+Xenopus+Zebrafish (GFF)
MULTIPLE SEQUENCE ALIGNMENTS:
- CLUSTALW DEFAULT [GOP 15 ] [GEP 6.66]
- CLUSTALW [GOP 15] [GEP 10 (maximum)]
- CLUSTALW [GOP 15] [GEP 0.05 (minimum)]
- CLUSTALW [GOP 100 (maximum)] [GEP 6.66]
- CLUSTALW [GOP 1 (minimum)] [GEP 6.66]
- CLUSTALW [GOP 1 (minimum)] [GEP 0.05 (minimum)]
- CLUSTALW [GOP 100 (maximum)] [GEP 0.05 (minimum)]
- CLUSTALW [GOP 100 (maximum)] [GEP 10 (maximum)]
 |
|
|
| MEME AS MAPPING FUNCTION |
The program MEME is a tool for discovering motifs in a group of related DNA or protein sequences. We have used MEME as another mapping function for analyzing the Actin ?-cardiac and the Myoglobin. The motifs detected by MEME on the H+M+C+Z orthologous promoters have been input to the multiple TF-map alignment to produce the following results:
PROMOTERS (500 bps, FASTA):
- Human (M13483)
- Mouse (M26773)
- Chicken (NM_001031229)
- Zebrafish (NM_214784)
- Human (X00371)
- Mouse (NM_013593)
- Chicken (NM_203377)
- Zebrafish (NM_200586)
TF-MAPPING (MEME results):
- MEME patterns on Actin ?-cardiac (HTML)
- MEME patterns on Myoglobin(HTML)
- MEME patterns on Actin ?-cardiac (GFF)
- MEME patterns on Myoglobin(GFF)
MULTIPLE TF-MAP ALIGNMENT:
- MMAs on Actin ?-cardiac promoters (GFF)
- MMAs on Myoglobin promoters (GFF)
 |
|
|
 |
|
|
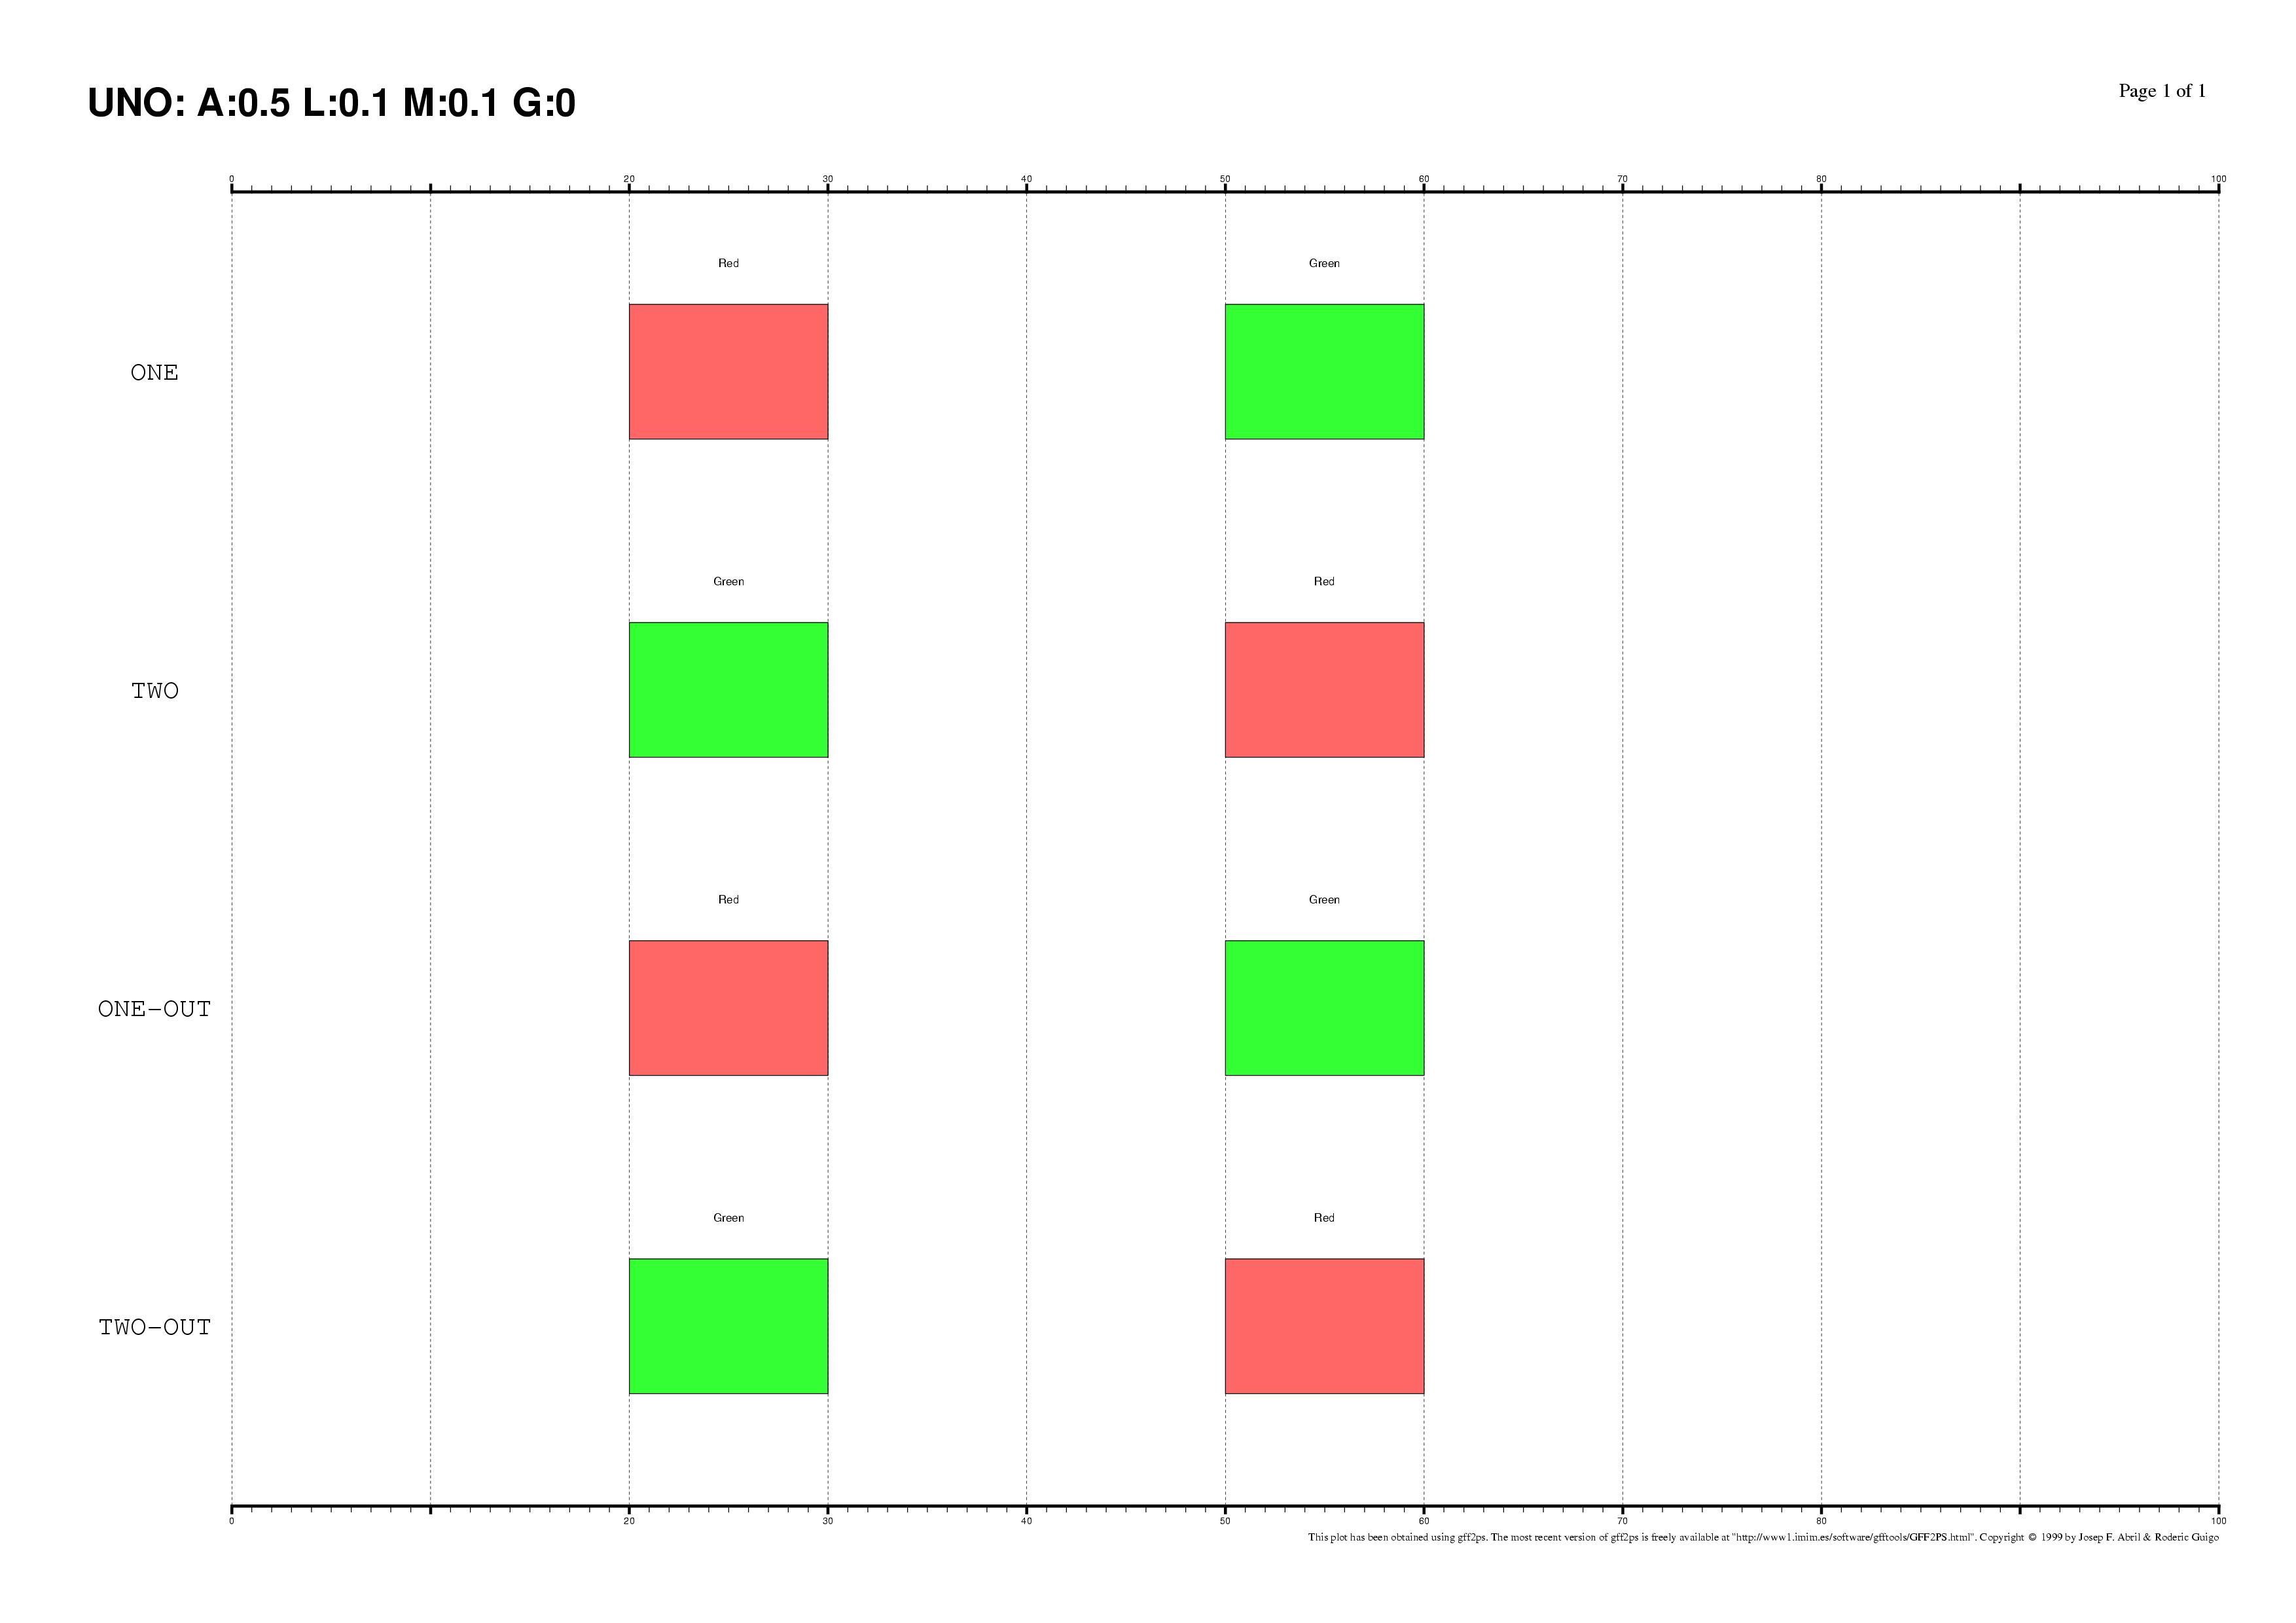
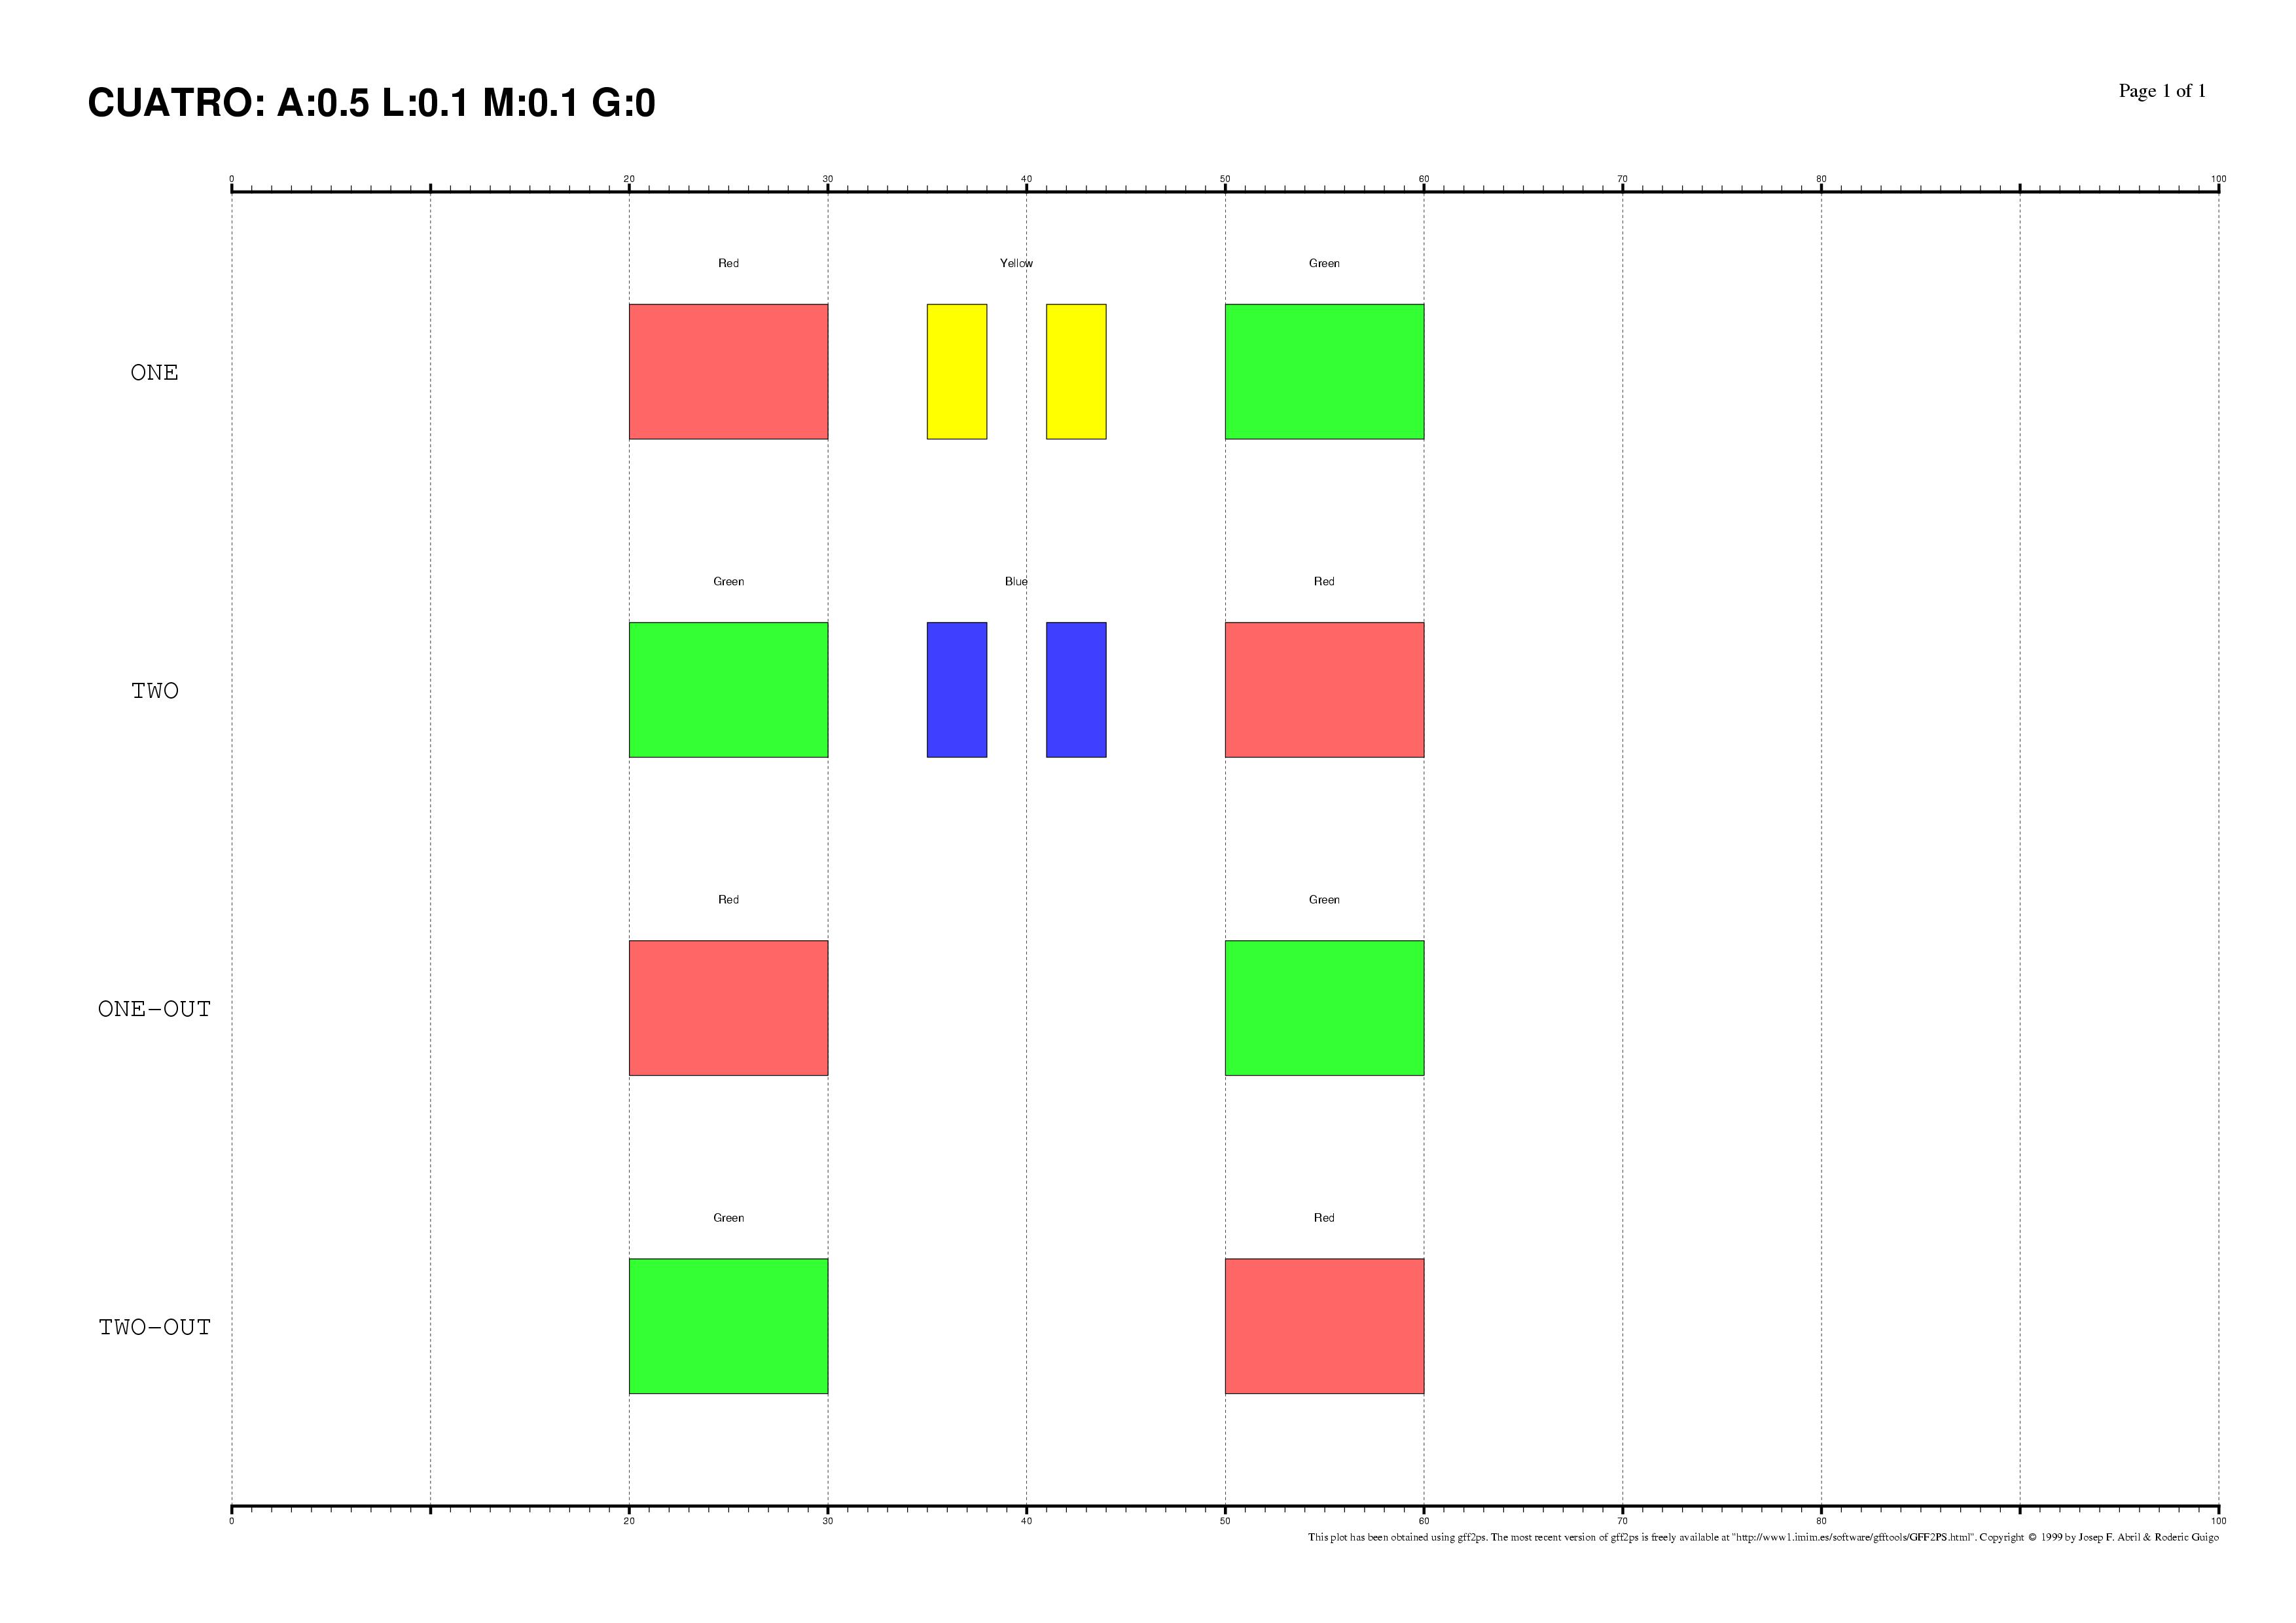
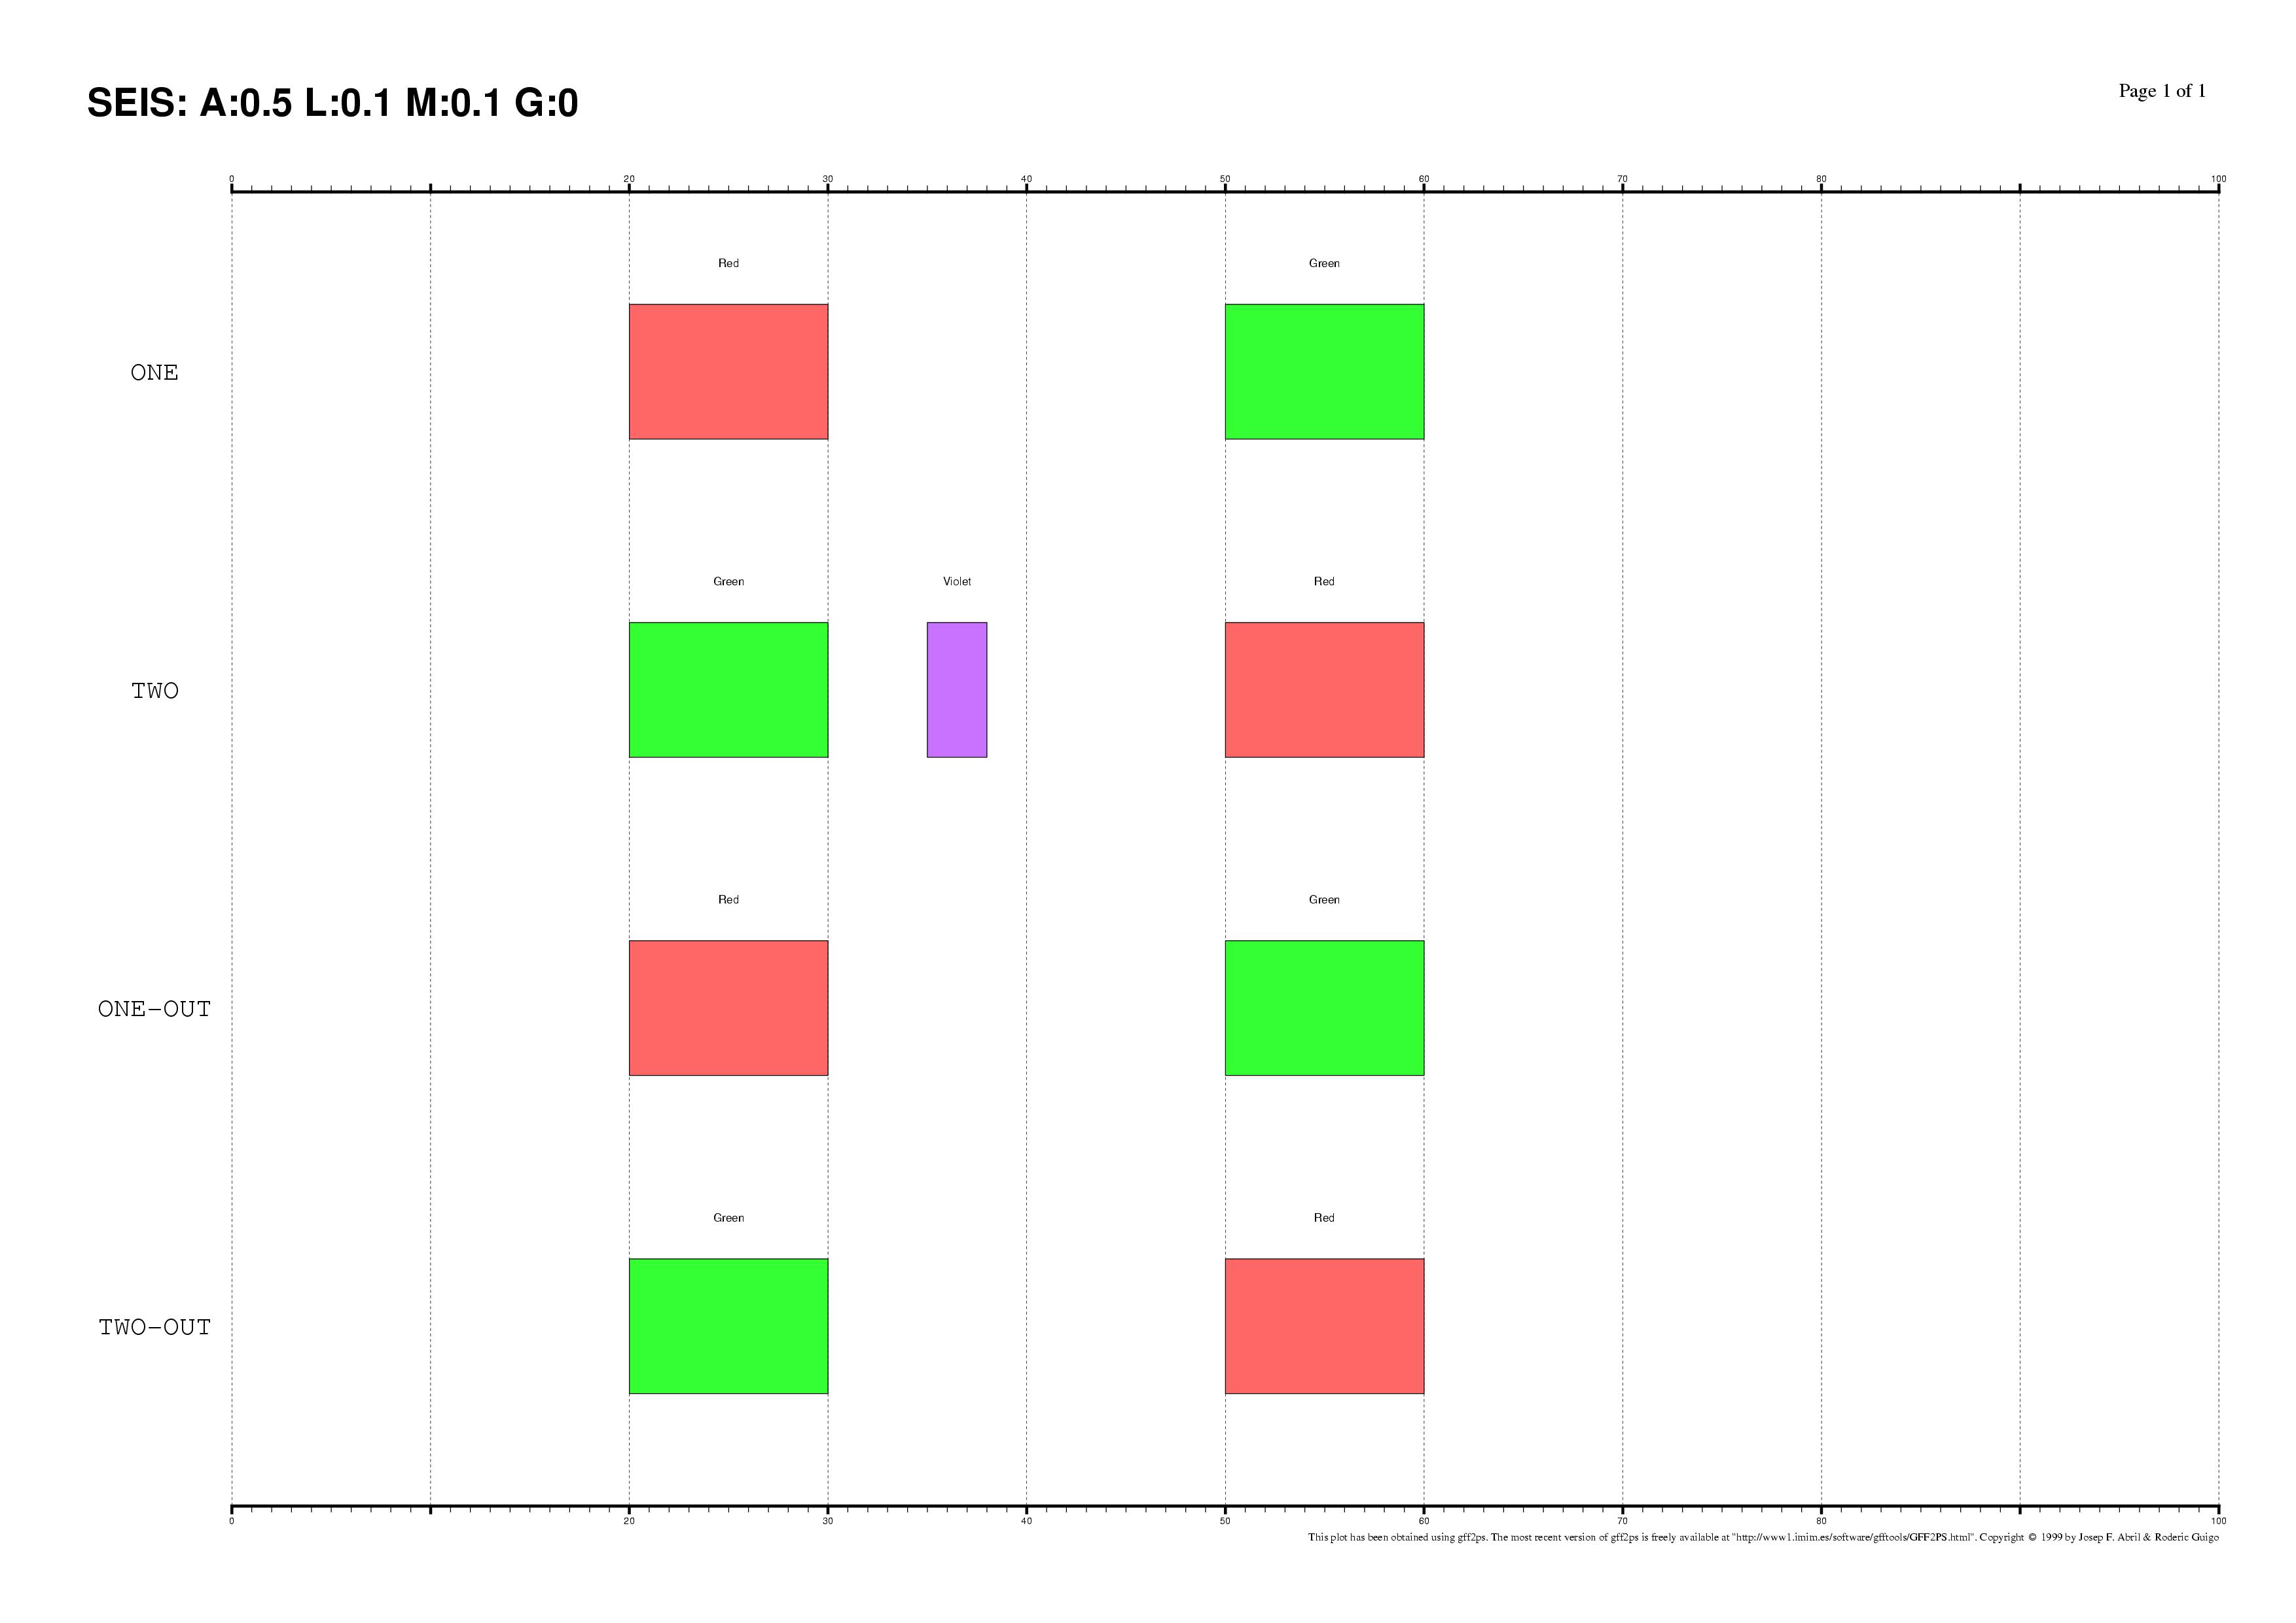
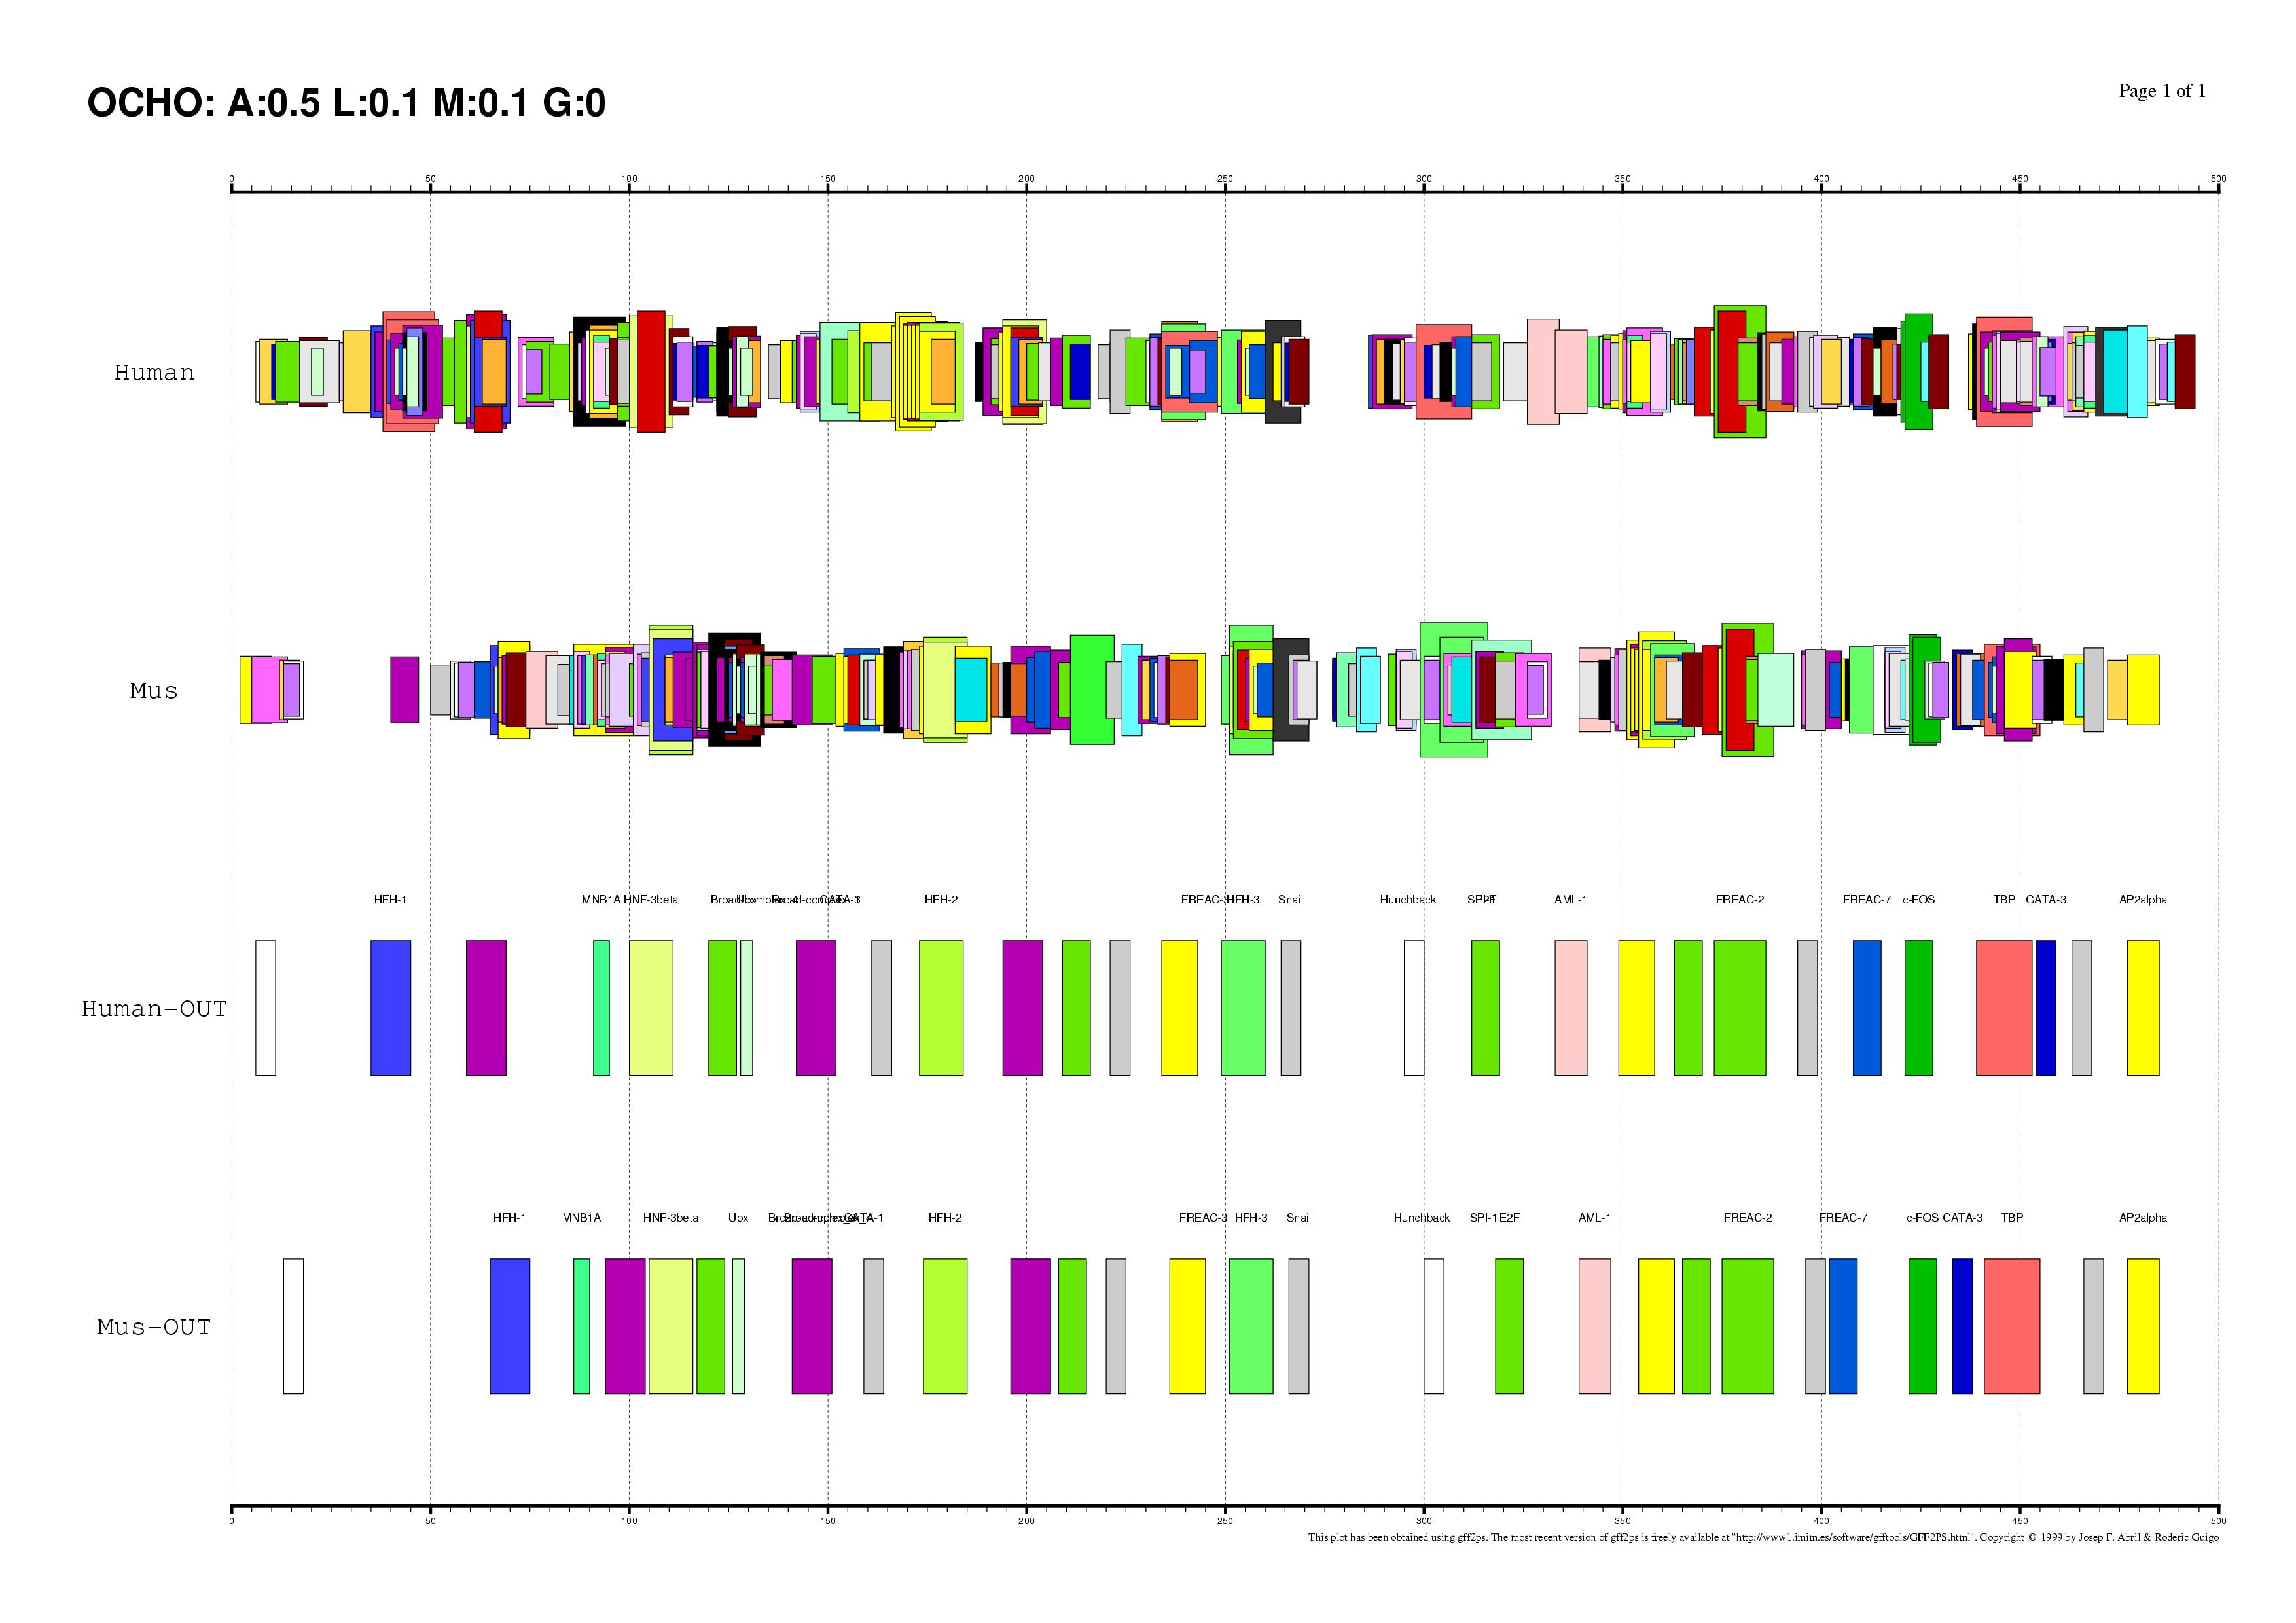
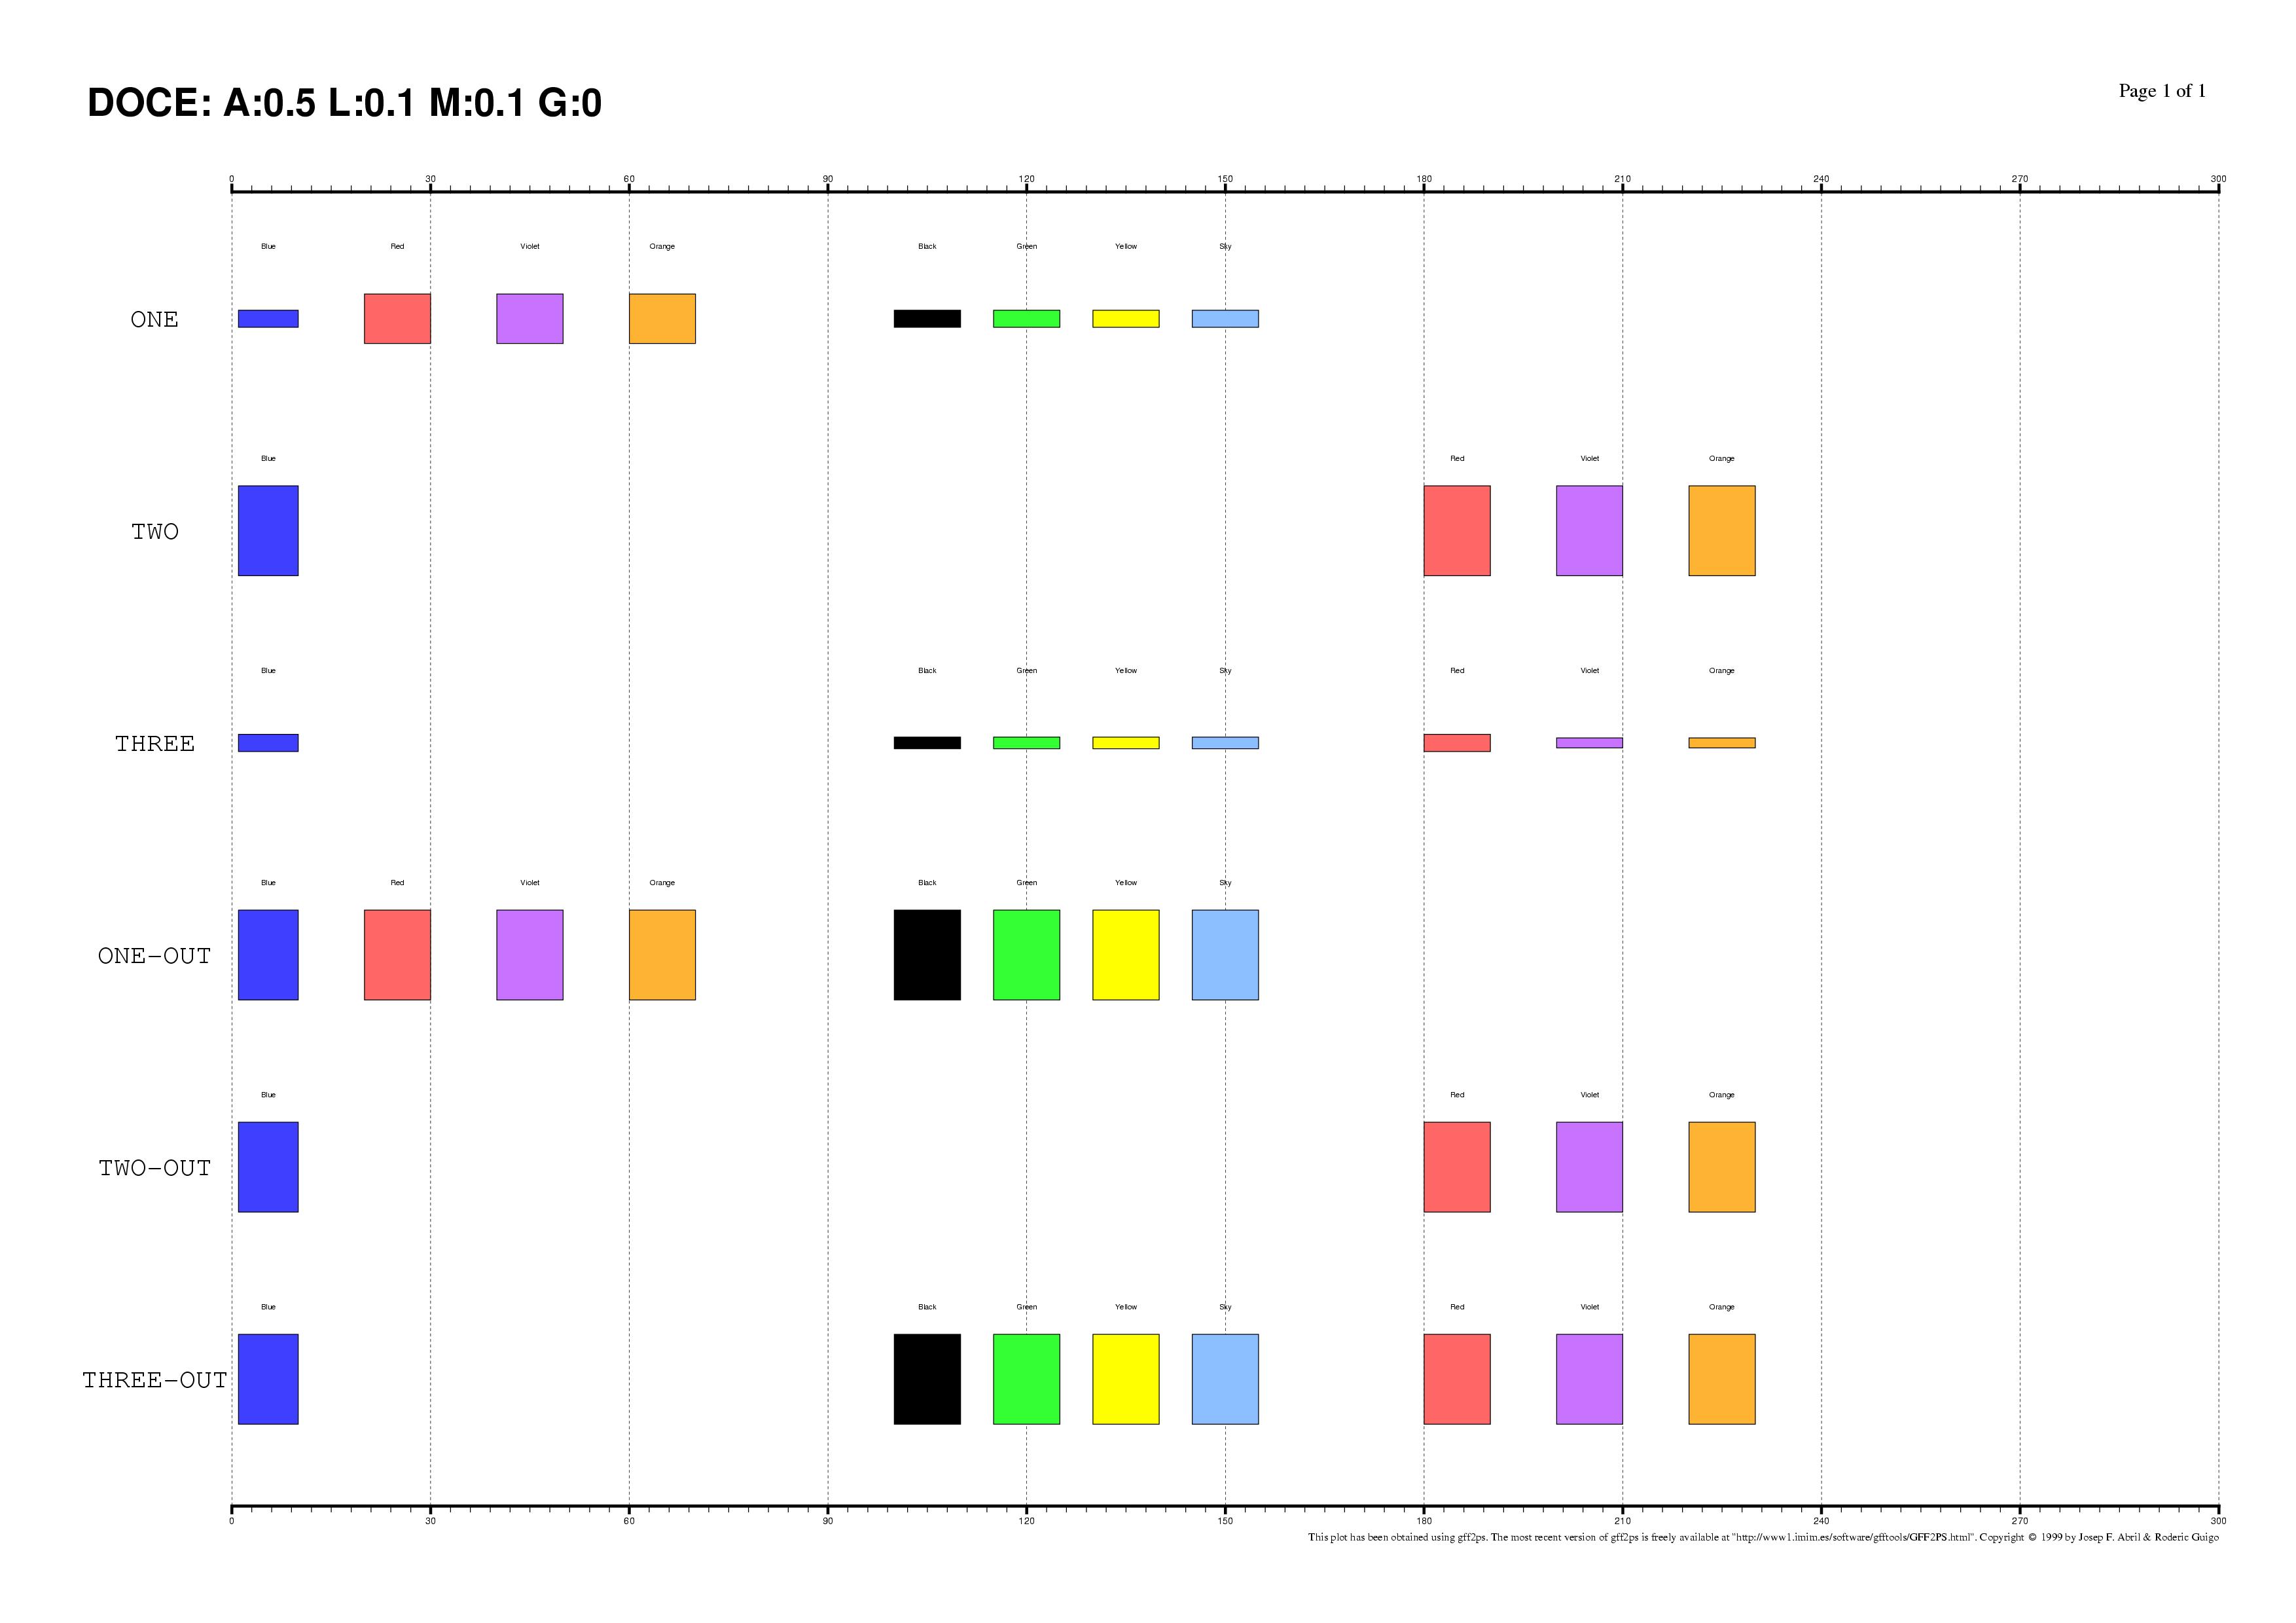
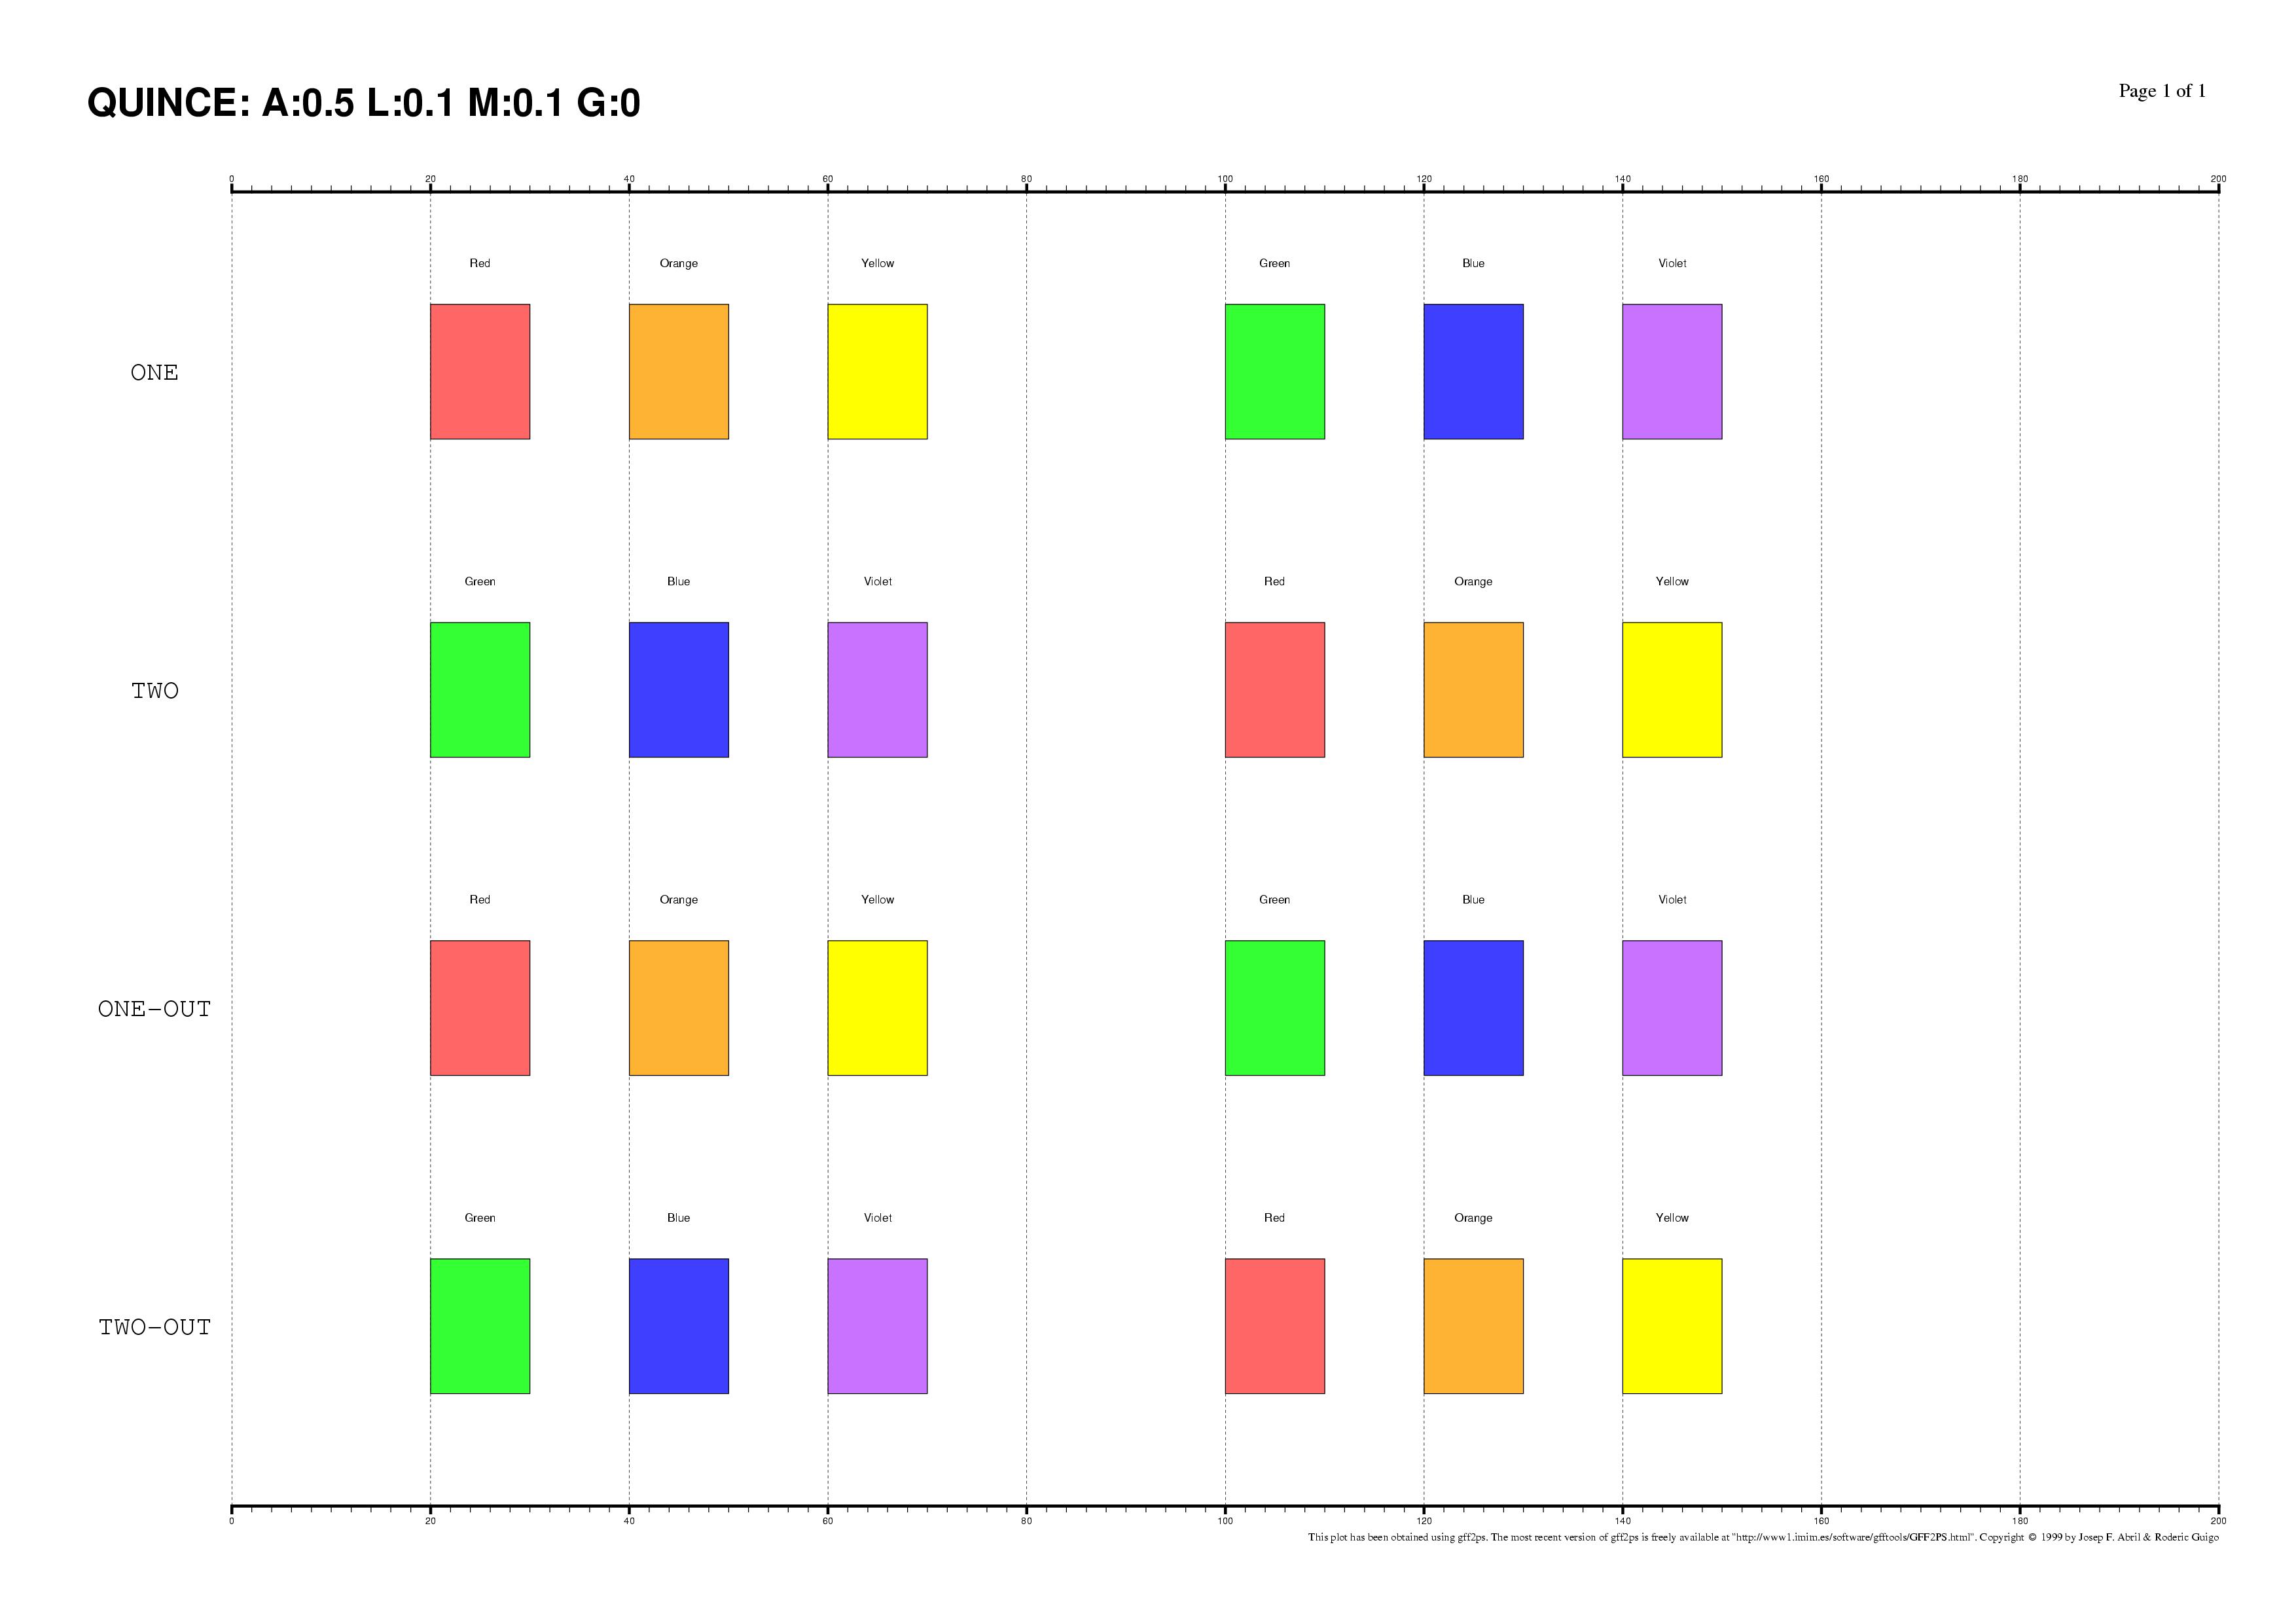
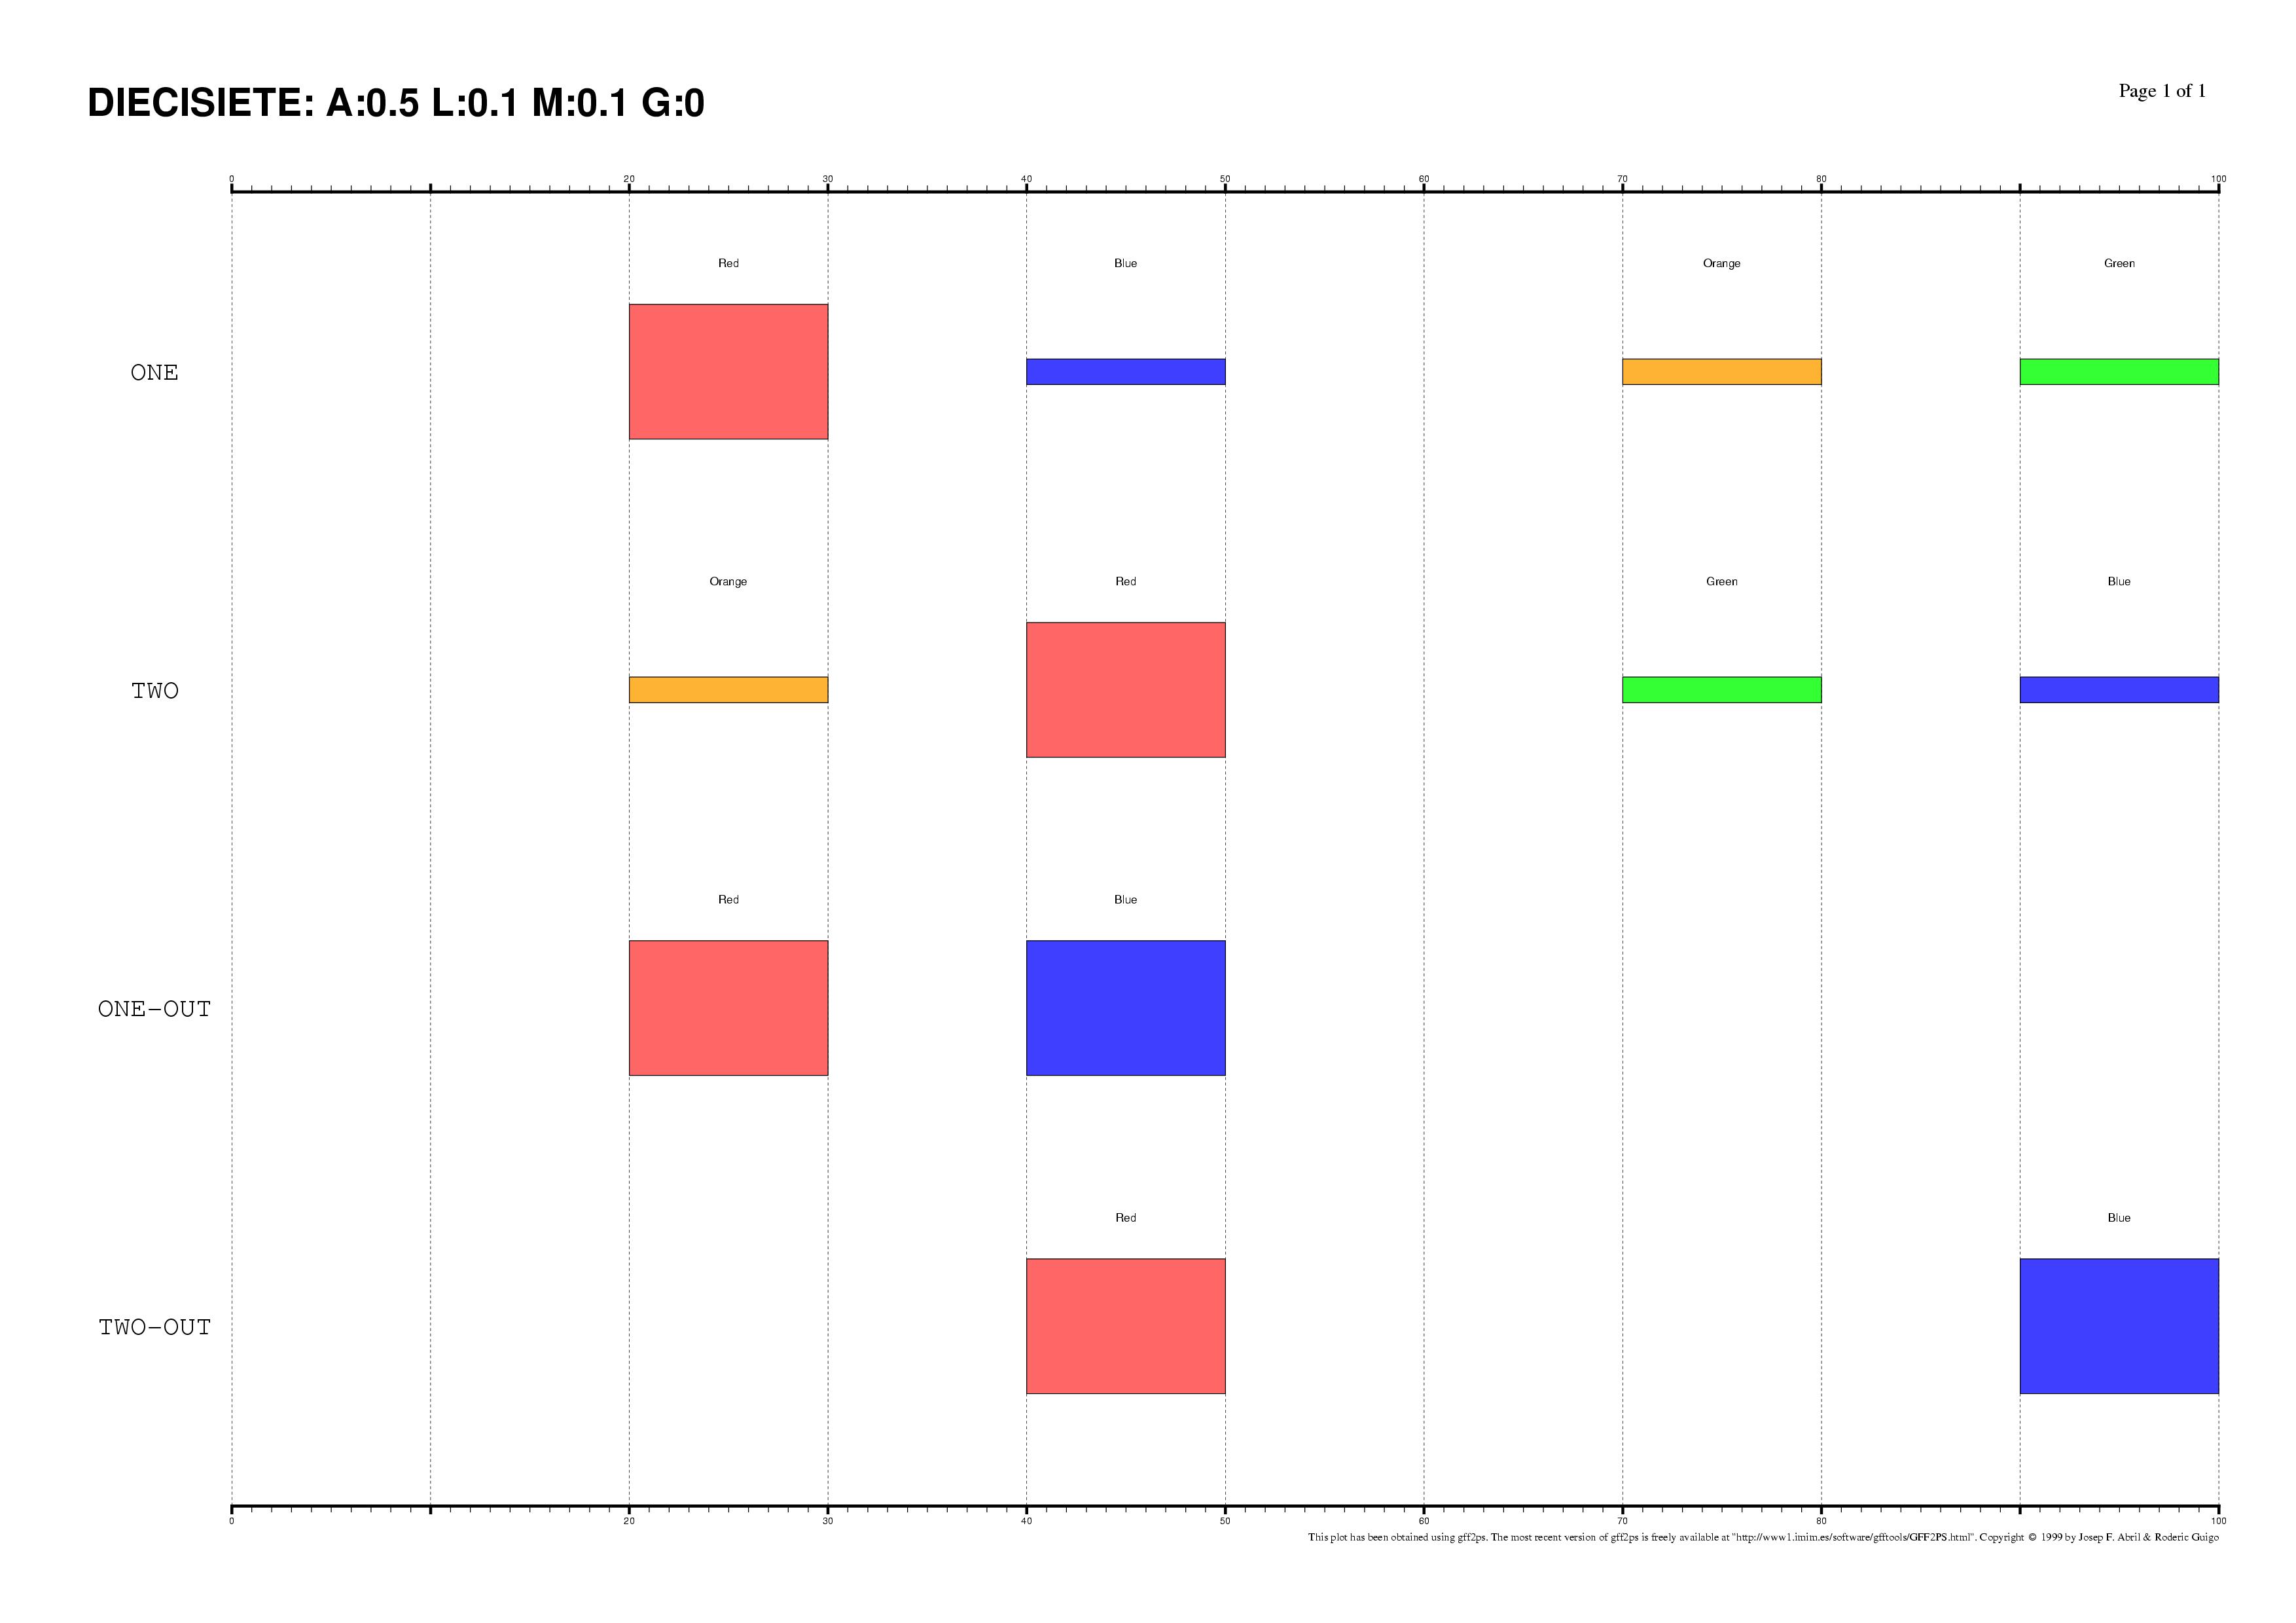
| NON-COLLINEAR ARTIFICIAL ALIGNMENTS |
The existence of regulatory elements that are conserved in different order between related promoter regions is documented, specially in enhancers. Even at the sequence level, the identification of these DNA rearrangements is very difficult. We have here introduced some subtle changes in the pairwise TF-map alignment algorithm shown before to deal with non-collinear alignments. The aligned TFBSs in such MMAs are therefore not necessarily located in the same relative order in every map.
This is an artificial set of non-collinear examples constructed and aligned with the multiple TF-map alignments (on top, the predictions/the input, on bottom, the TF-map alignment/the output):
 |
input | output |  |
input | output |
 |
input | output | 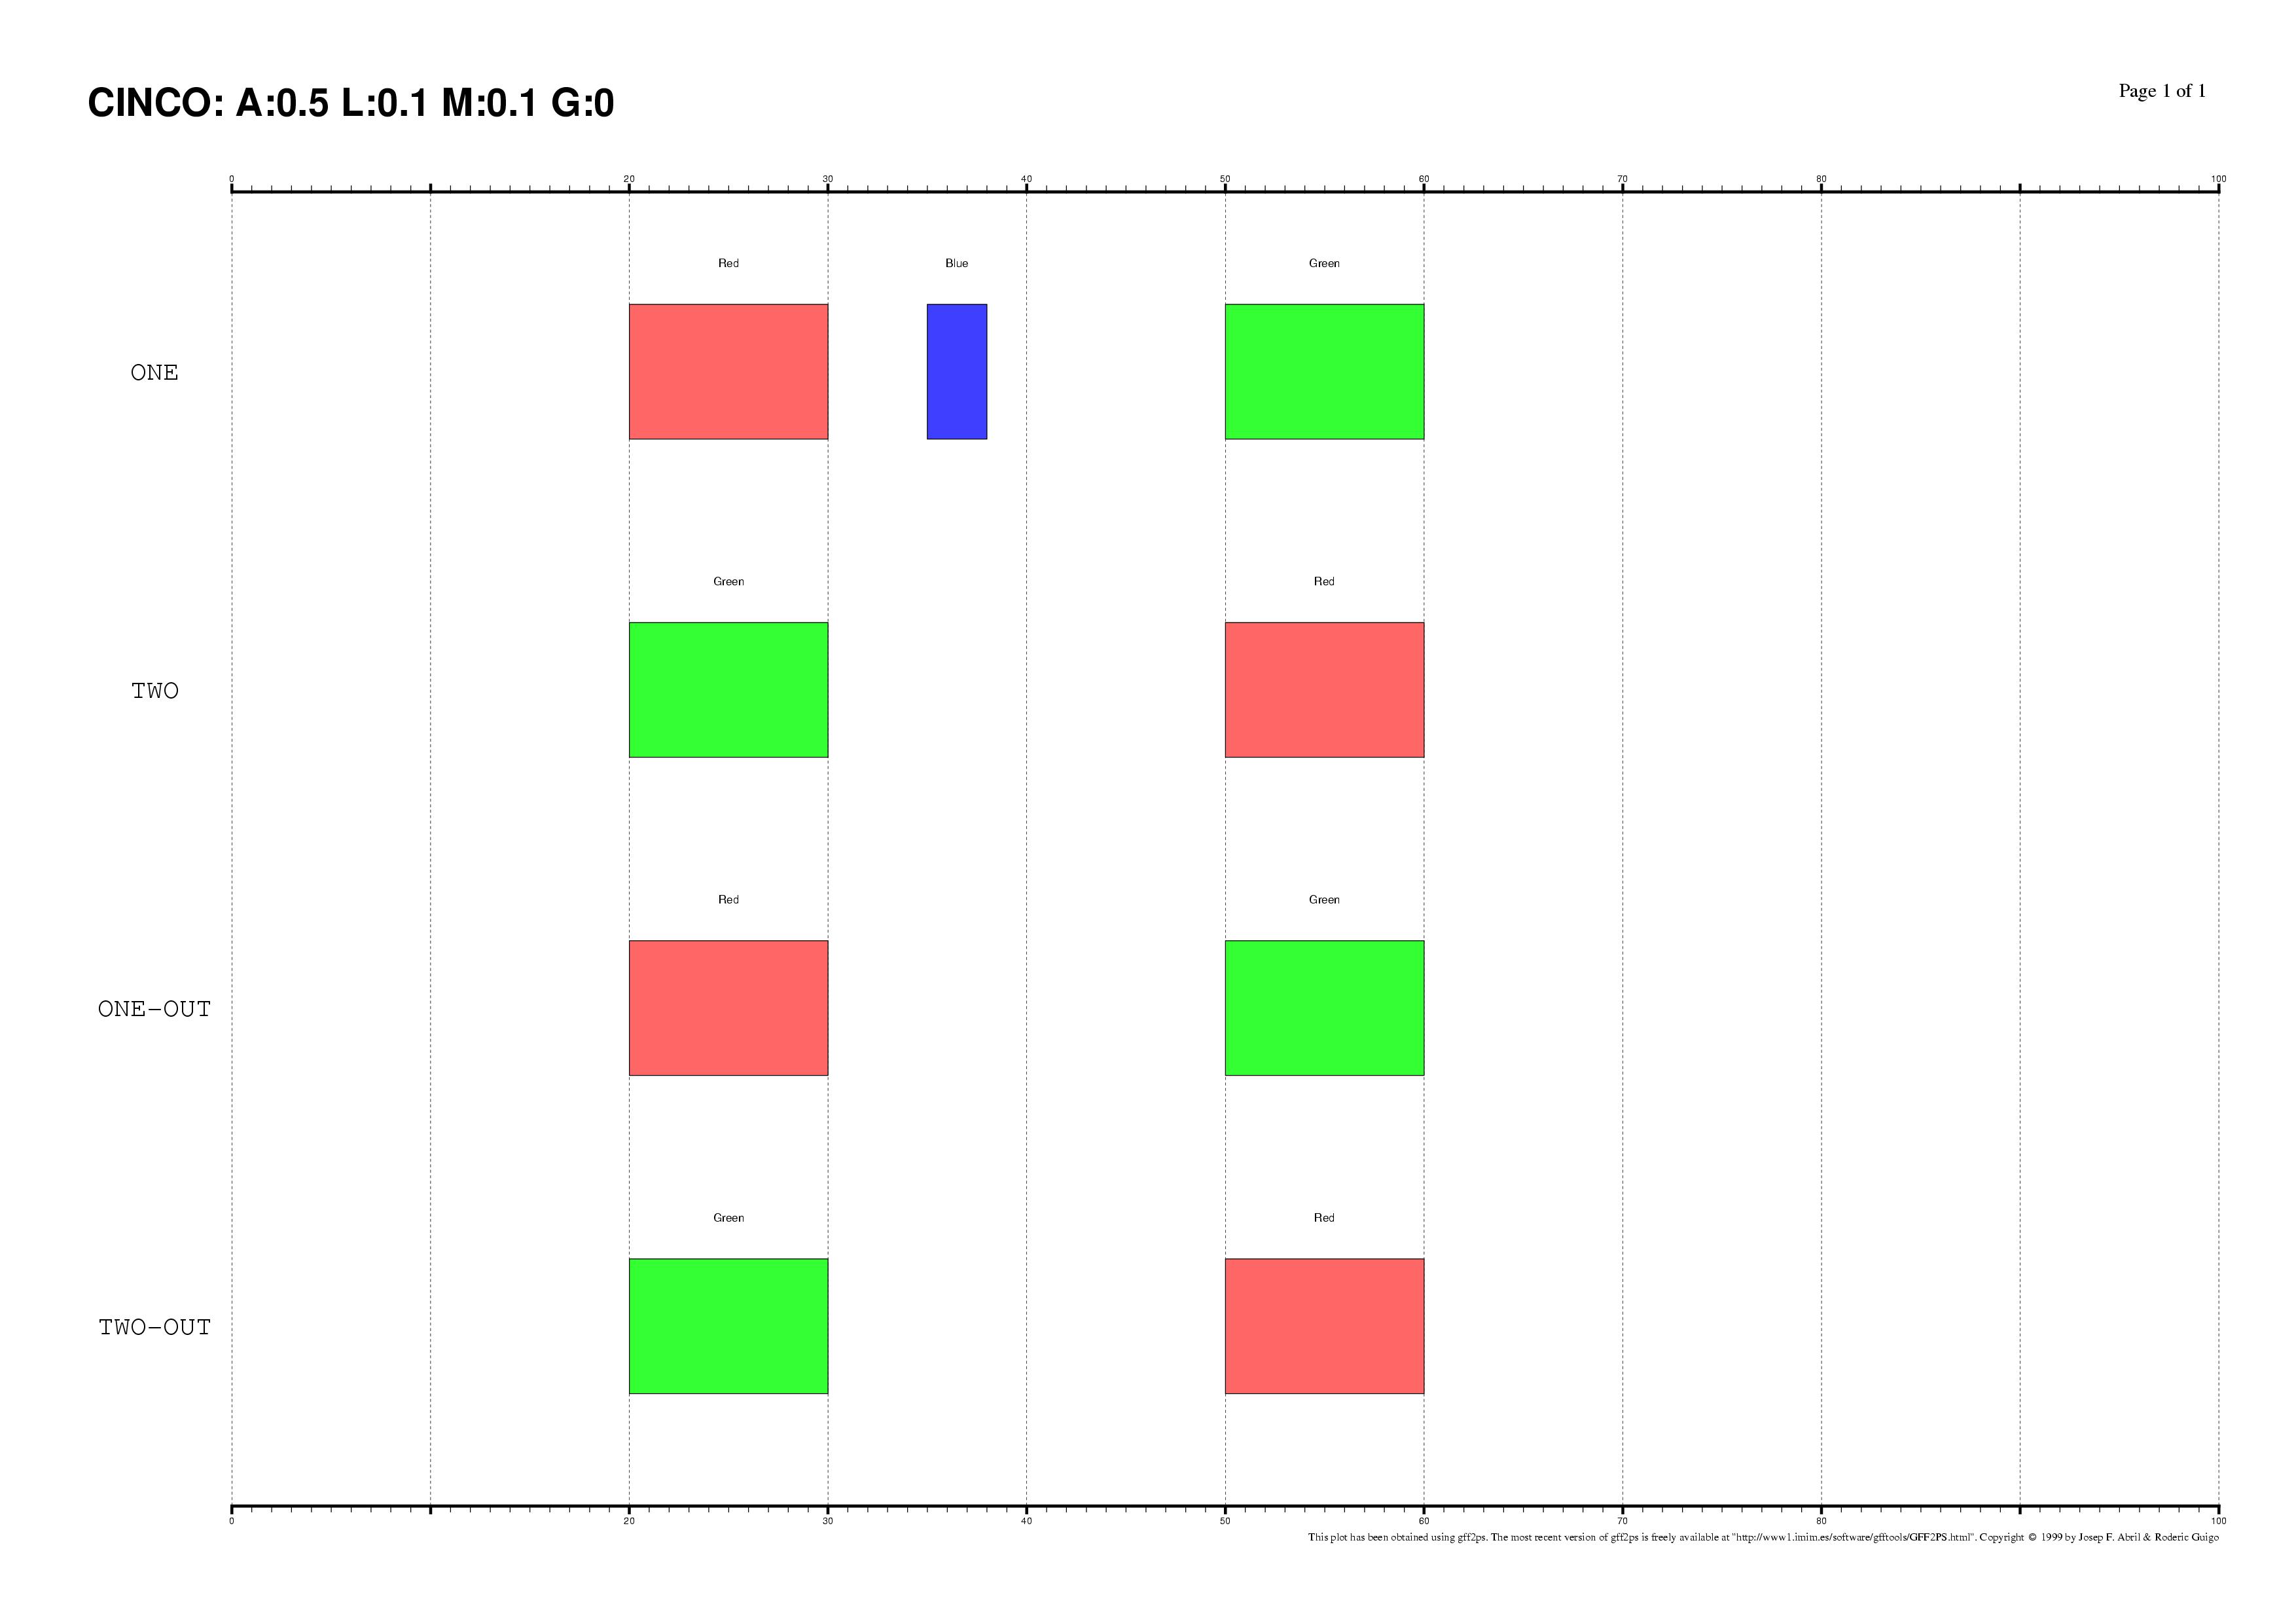 |
input | output |
 |
input | output | 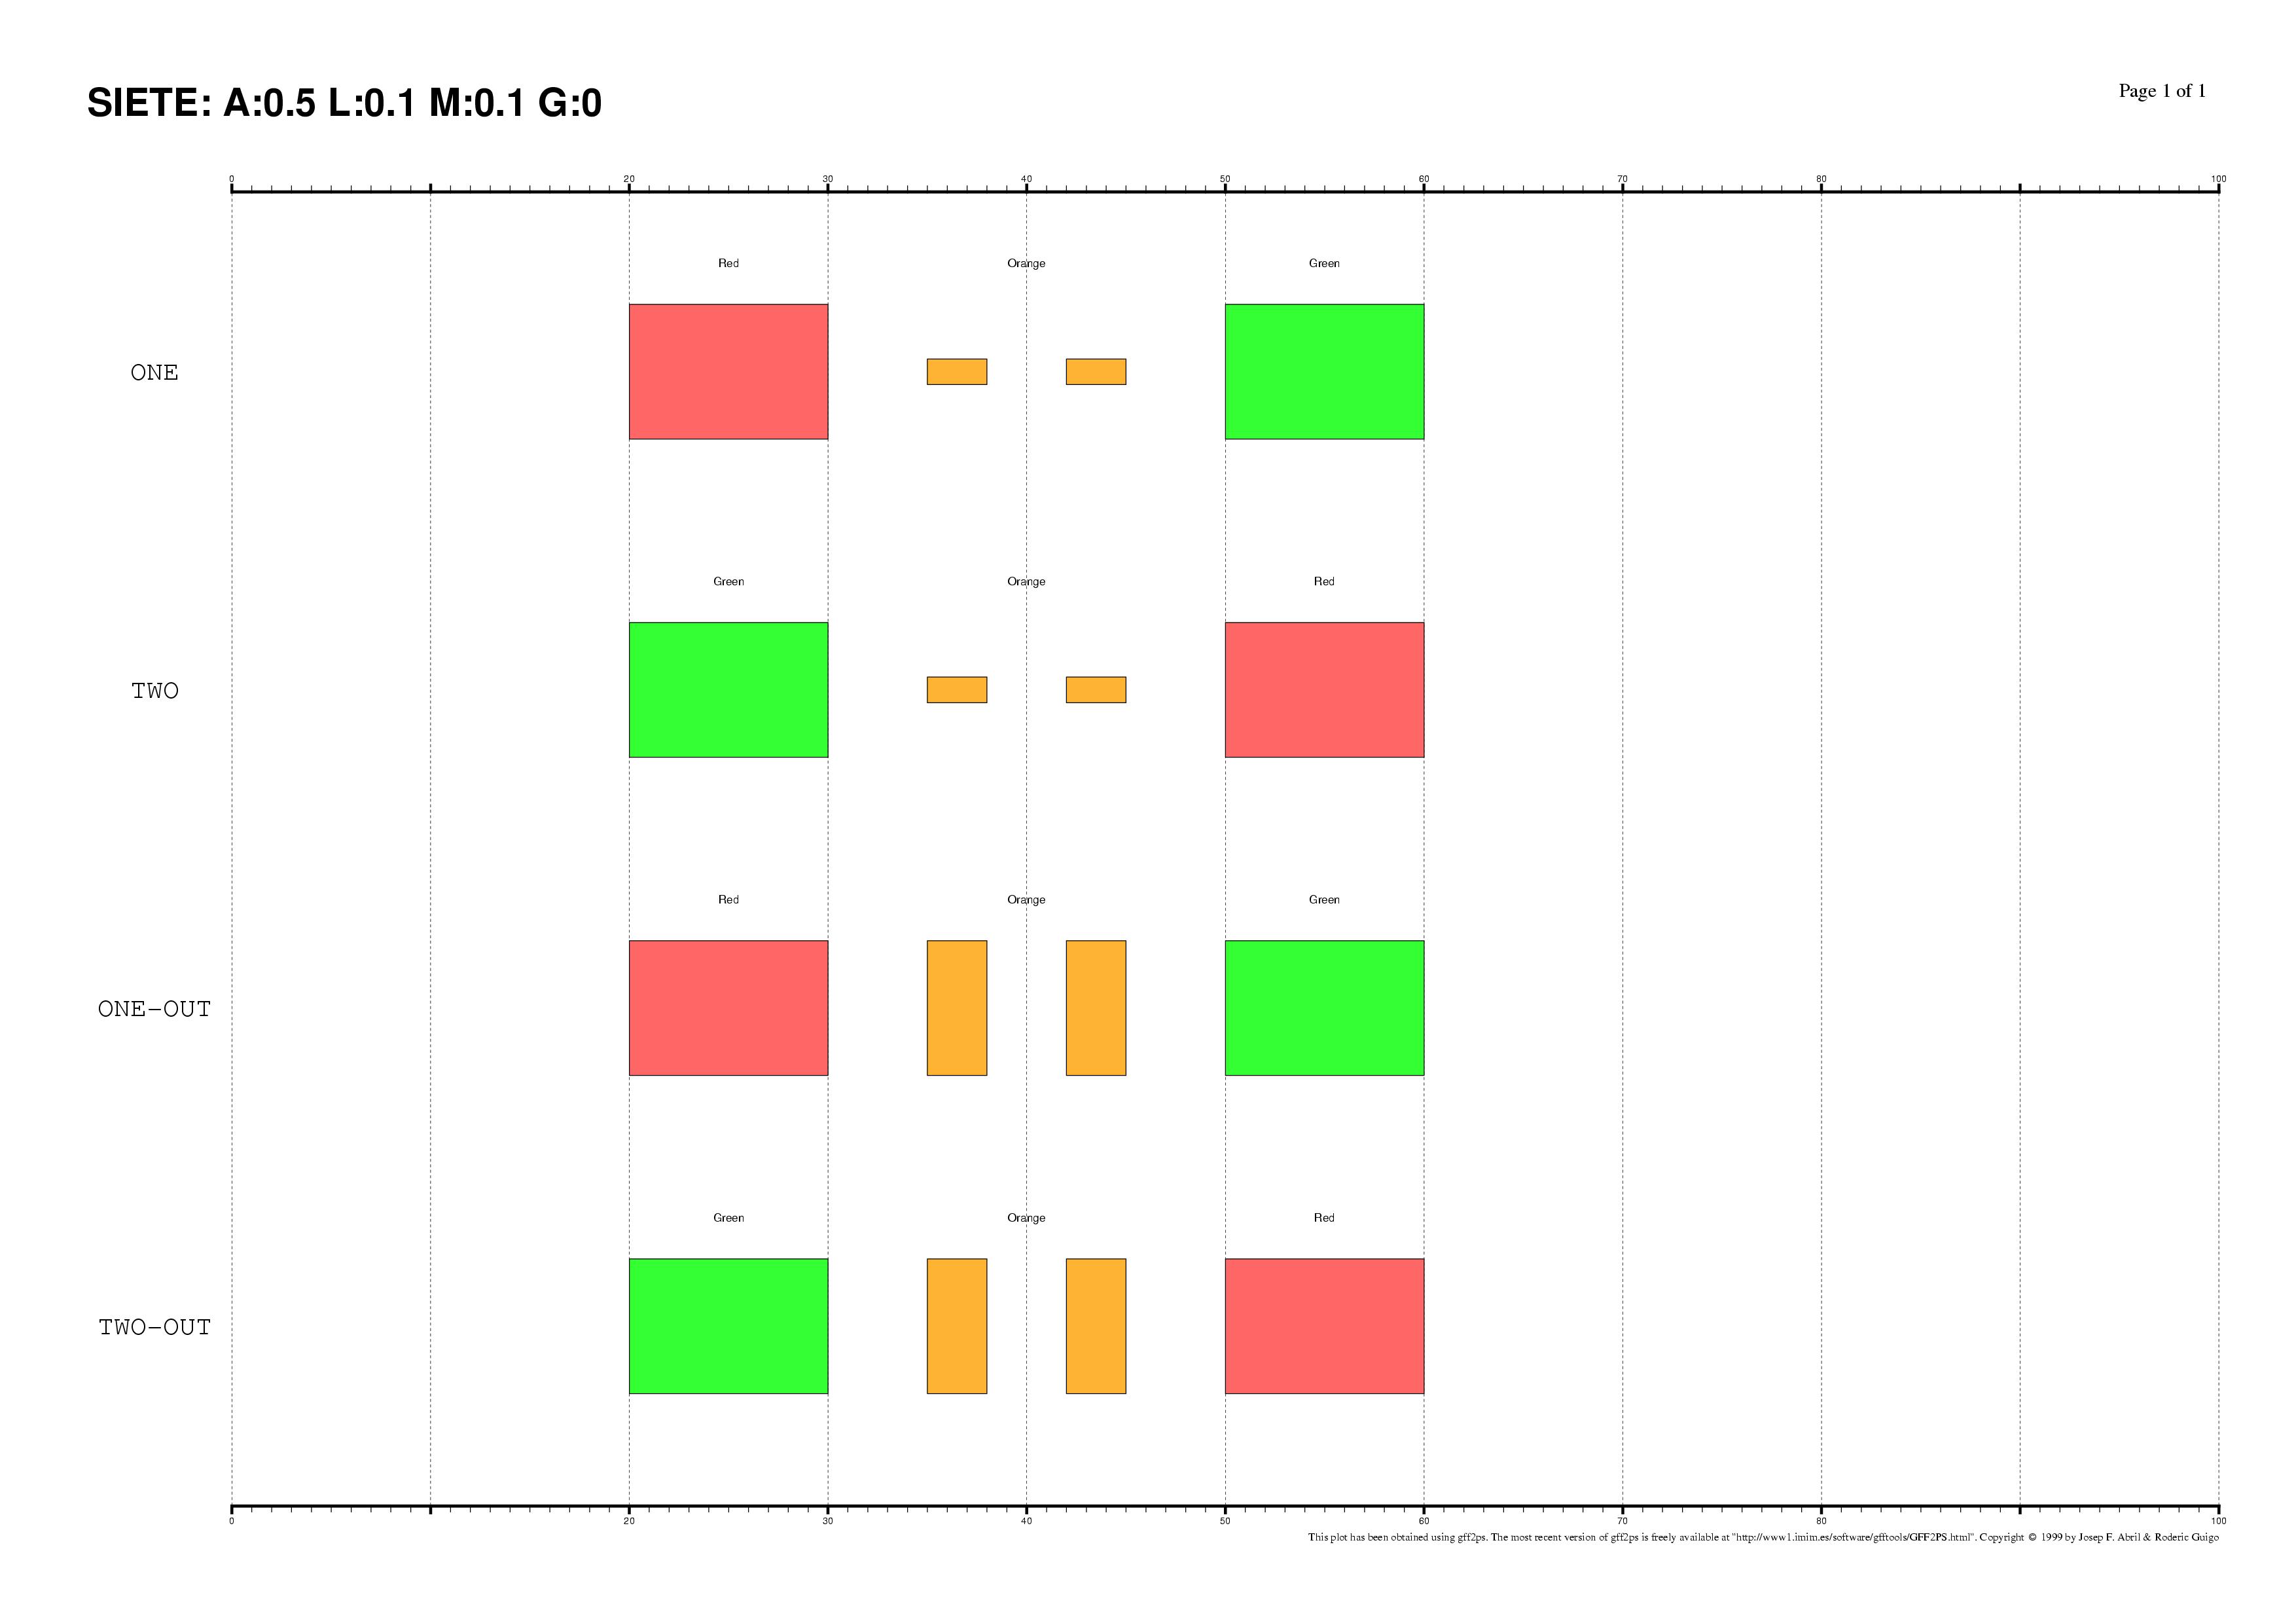 |
input | output |
 |
input | output |  |
input | output |
 |
input | output | 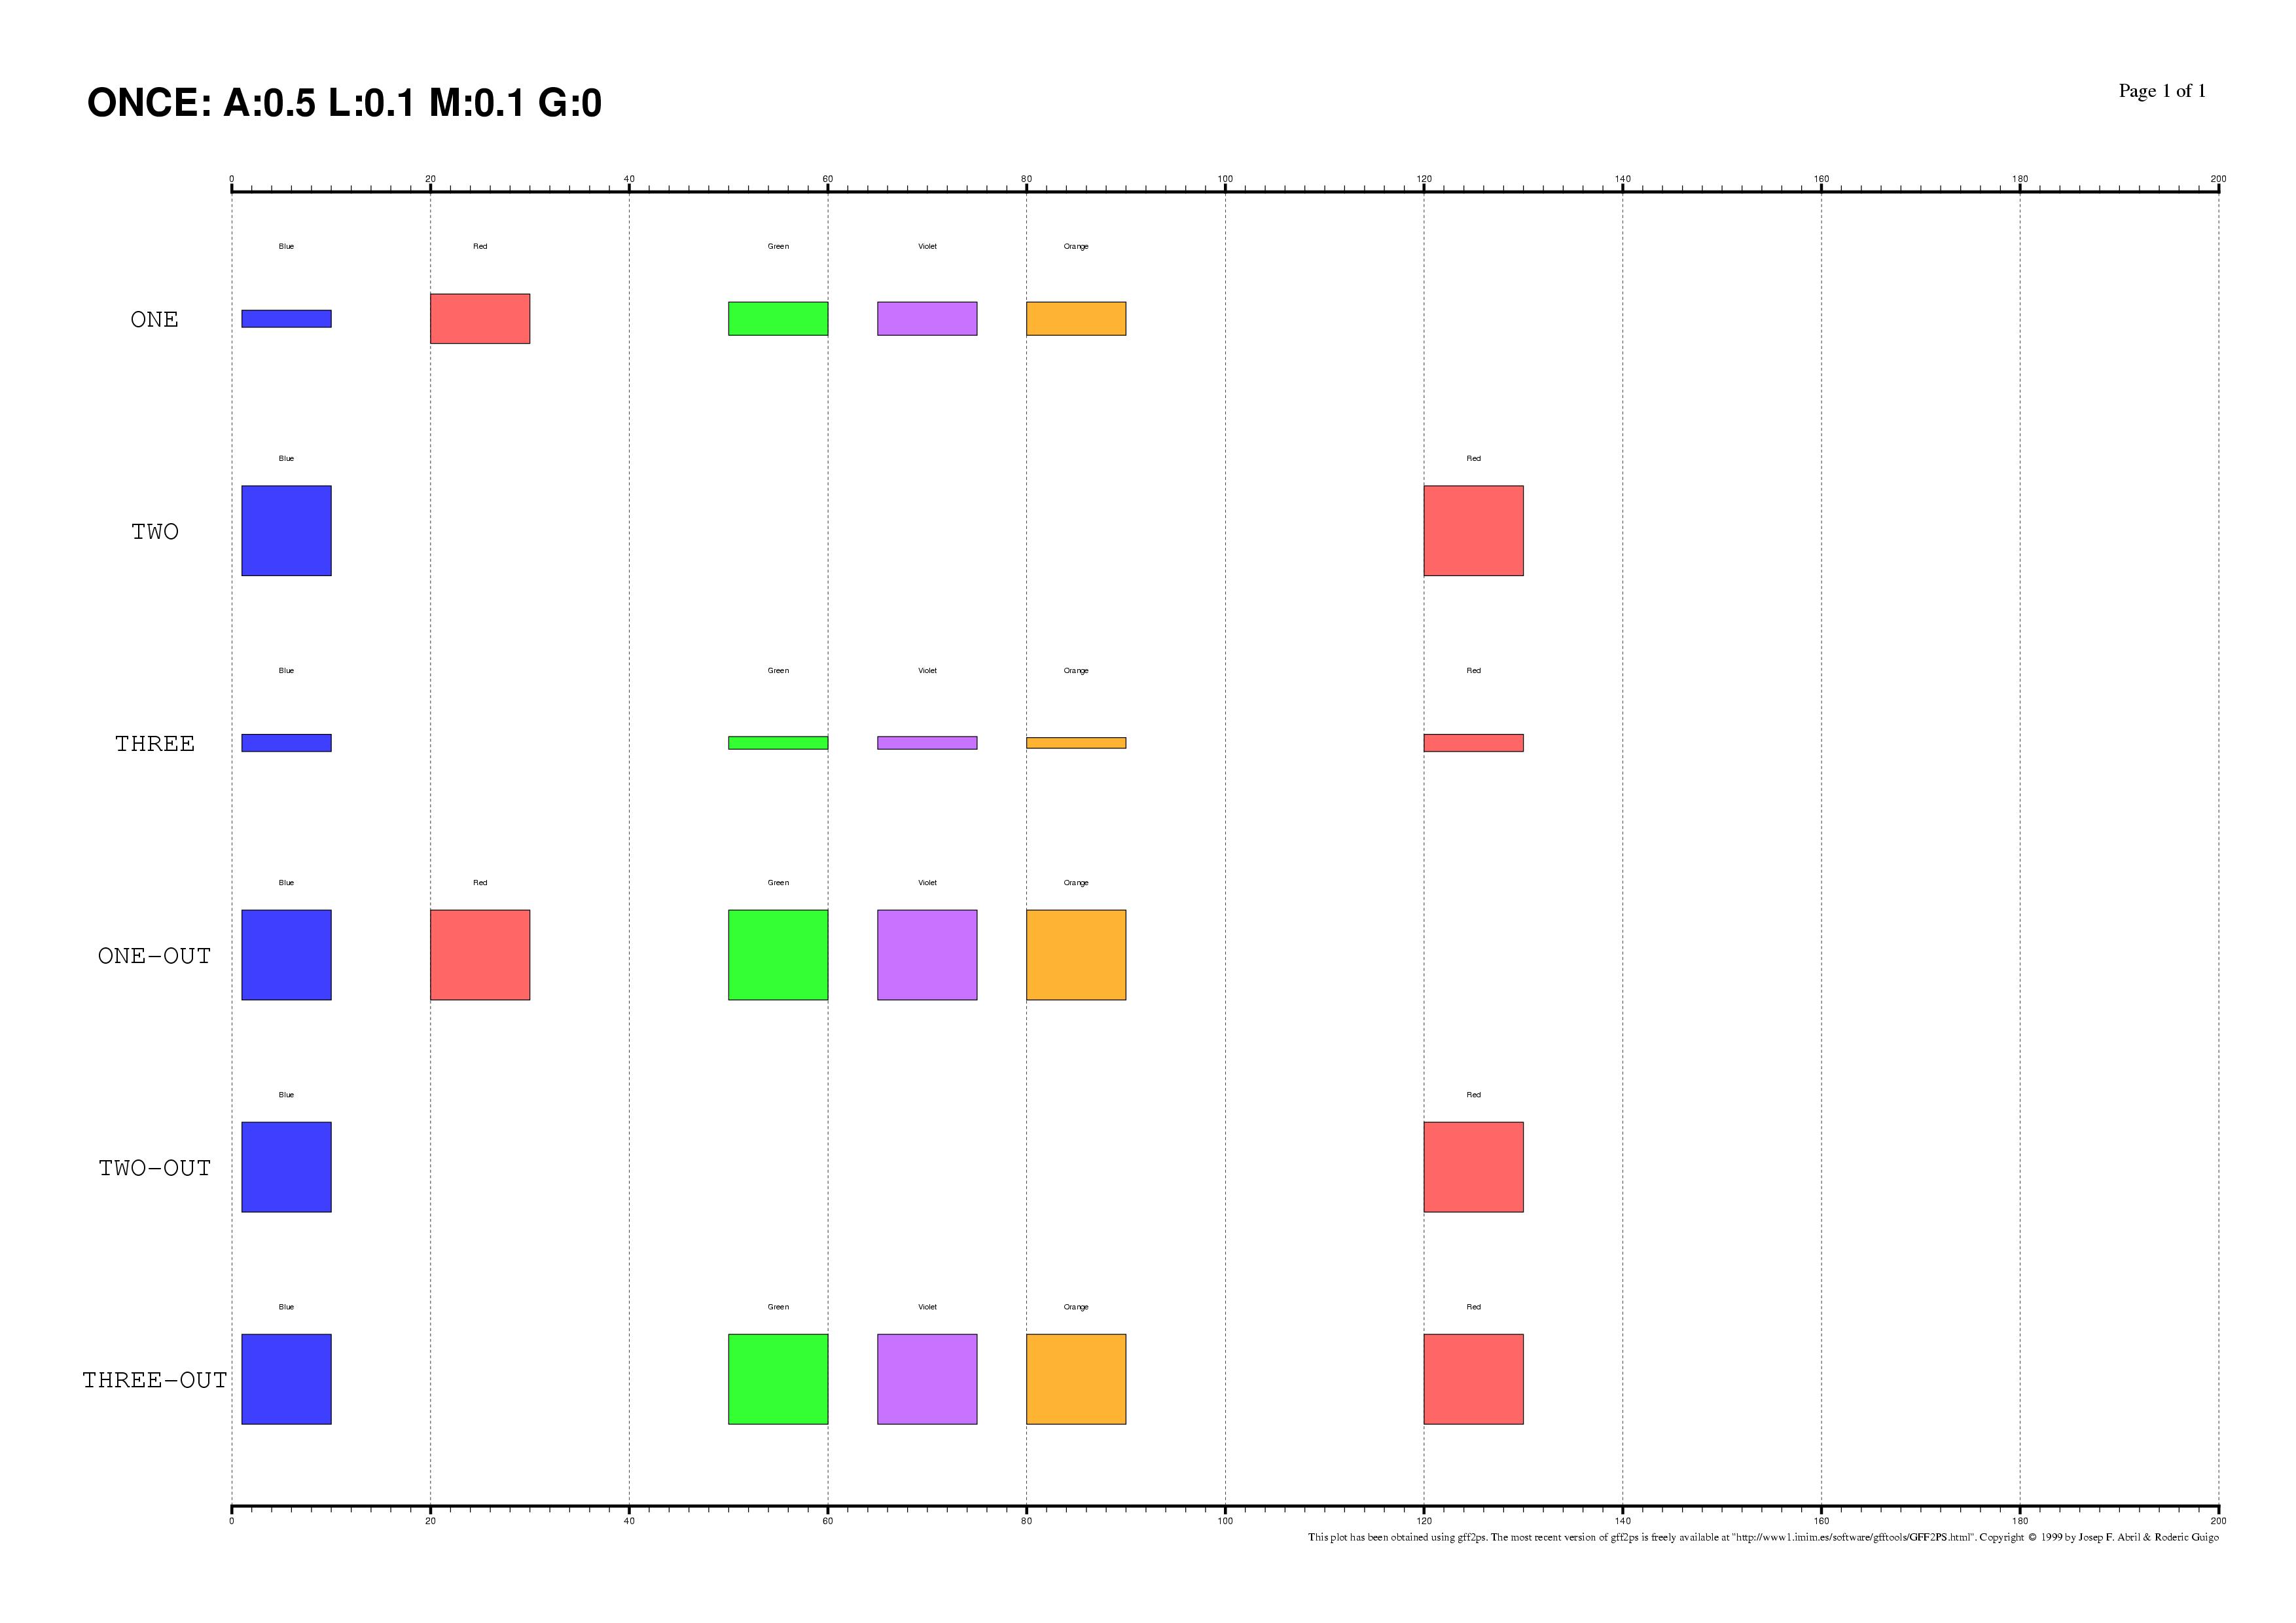 |
input | output |
 |
input | output | 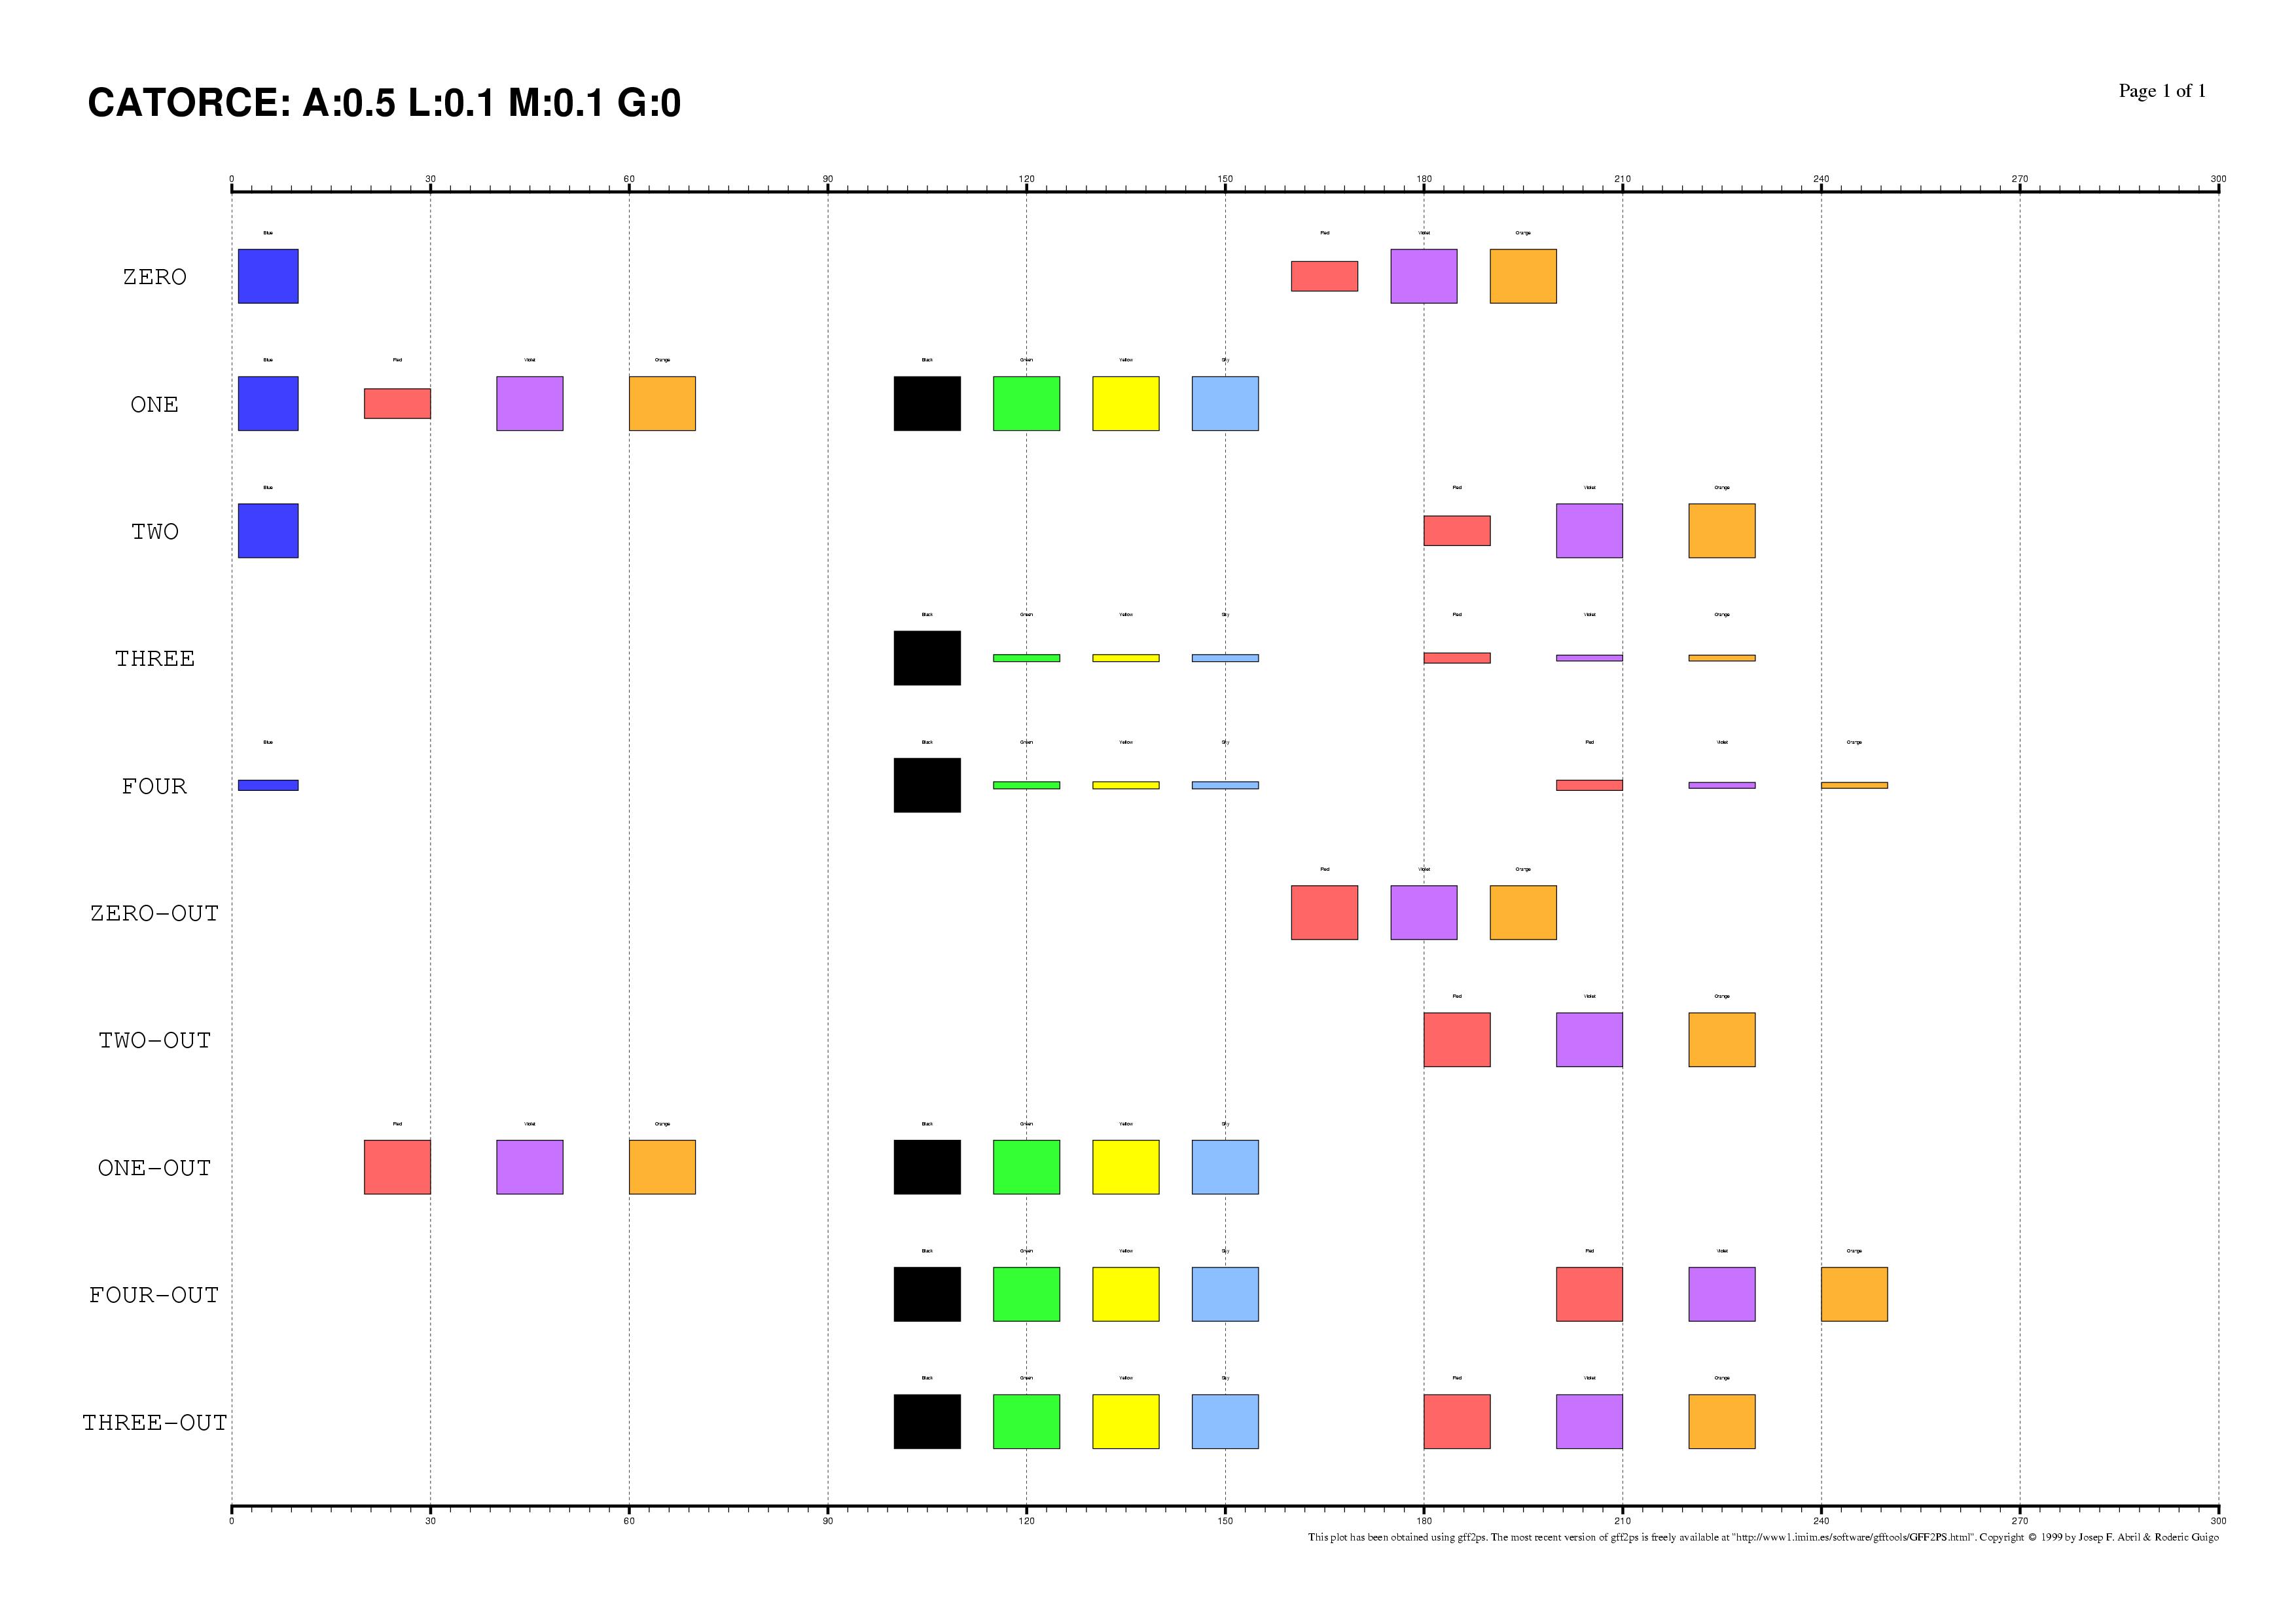 |
input | output |
 |
input | output |  |
input | output |
 |
input | output | 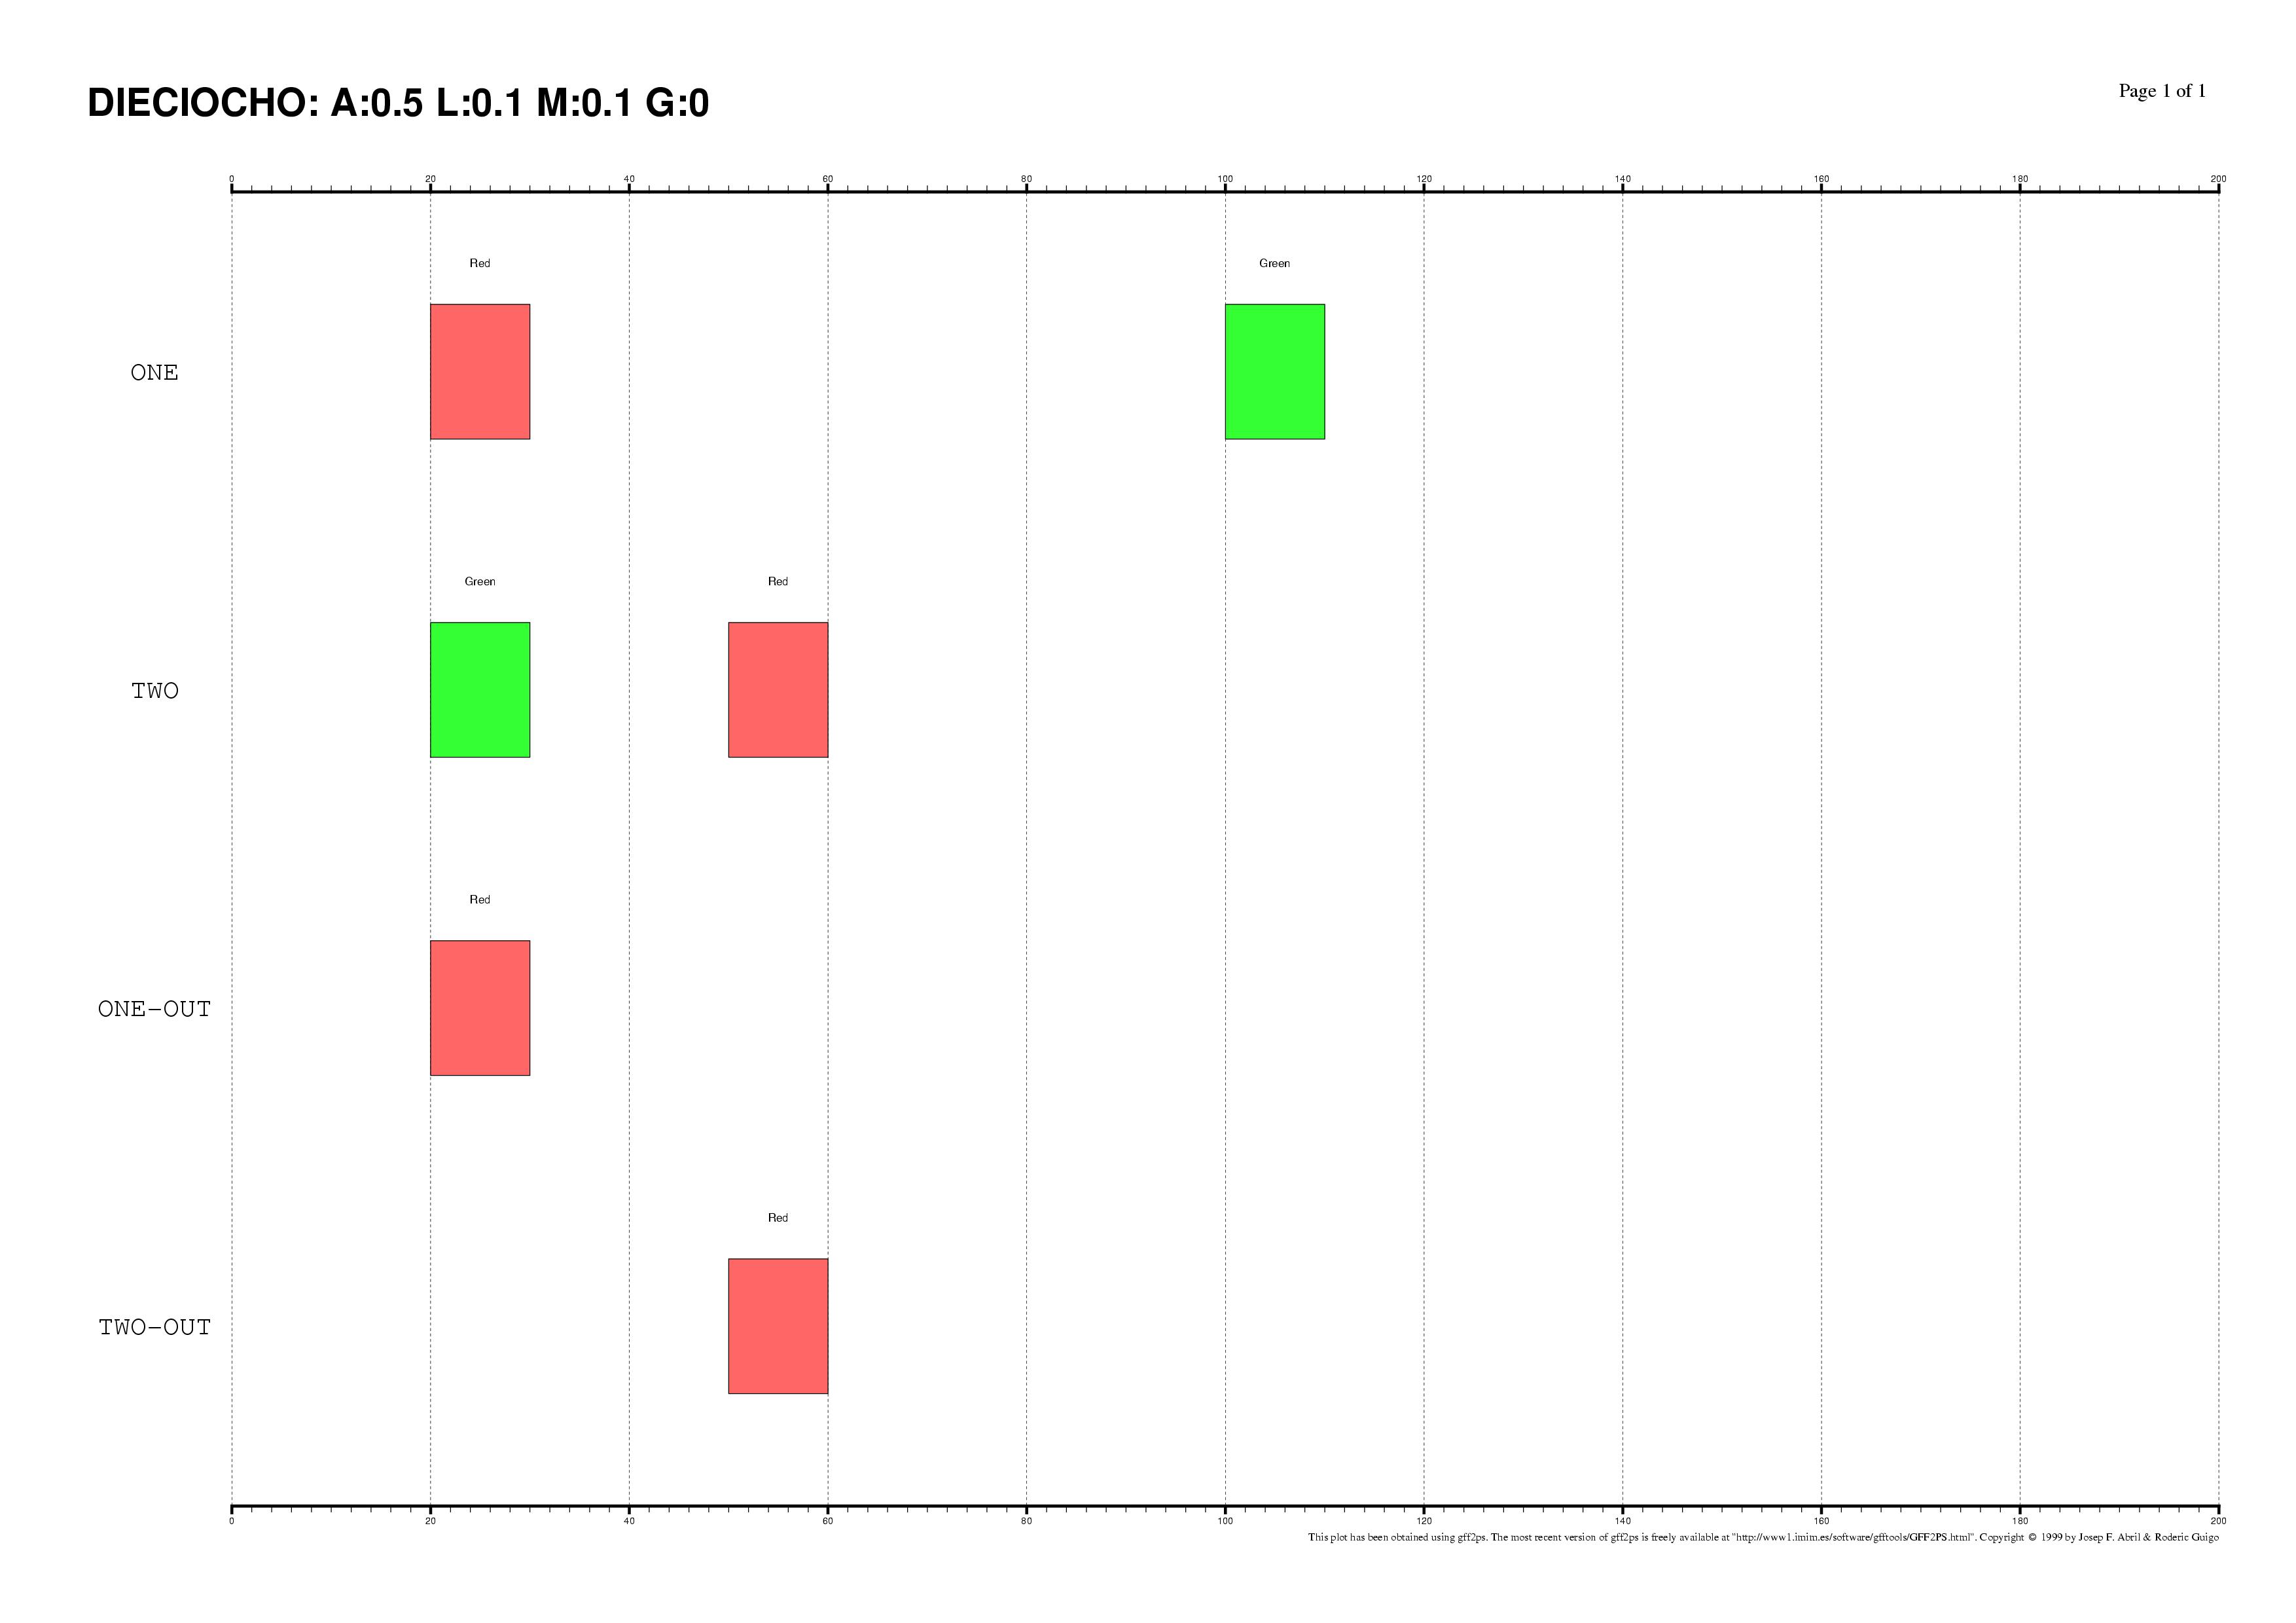 |
input | output |
 |
input | output | |||
|
|
|||||
Identification of non-collinear configurations of TFBSs in regulatory regions is poorly known. We recommend, therefore, to use this option very carefully. In addition, we also suggest the use of a small set of matrices to perform the mapping, which can reduce the number of artifacts in the resulting non-collinear MMA.
| SOFTWARE HOME PAGE |
The home page of the software implementing the multiple TF-map alignment is at:
MULTIPLE TF-MAP ALIGNMENT HOME PAGE
Here you can find:
- The source code of the program
- Benchmarking test
- Examples of the output
The web server that performs the mapping and the multiple TF-map alignment is at:
MULTIPLE TF-MAP ALIGNMENT WEB SERVER
The available functions now are:
- Mapping applications to translate a promoter sequence into a TF-map with different collections and thresholds
- Multiple meta-alignment of up to 10 TF-maps allowing the user to configure the parameters
- Dummy example
| REFERENCES |
- E. Blanco, R. Guigó and X. Messeguer,
Multiple Non-Collinear Transcription Factor Map Alignment of Promoter Regions
BMC Bioinformatics 8:138 (2007).
[SOFTWARE] [DATA SETS] [PUBLICATION] - E. Blanco, X. Messeguer, T.F. Smith and R. Guigó
Transcription Factor Map Alignment of Promoter Regions
PLOS Computational Biology (2006, in press).
[SOFTWARE][DATA SETS][PUBLICATION] - E. Blanco, D. Farre, M. Alba, X. Messeguer and R. Guigó
ABS: a database of Annotated regulatory Binding Sites from orthologous promoters.
Nucleic Acids Research 34:D63-D67 (2006).
[DATABASE][PUBLICATION] - E. Blanco, X. Messeguer and R. Guigó
Novel computational methods to characterize regulatory regions.
CSHL - Systems Biology (Poster), New York, USA (2004) - E. Blanco, X. Messeguer and R. Guigó
Alignment of Promoter Regions by Mapping Nucleotide Sequences into Arrays
of Transcription Factor Binding Motifs.
VIIth RECOMB (Poster), Berlin, Germany (2003) - M.S. Waterman, T. F. Smith and H. L. Katcher
Algorithms for restriction map comparisons,
Nucleic Acids Research, 12:237-242 (1984). - M.Z. Ludwig and N.H. Patel and M. Kreitman
Functional analysis of eve stripe 2 enhancer evolution in
Drosophila: rules governing conservation and change
Development 125:949-958 (1998). - D. Vlieghe and A. Sandelin and P.J. De Bleser and K. Vleminckx and W.W. Wasserman and B. Lenhard
A new generation of JASPAR, the open-access repository for transcription factor binding site profiles
Nucleic Acids Research 34:D95-D97 (2006). - V. Matys and others
TRANSFAC and its module TRANSCompel: transcriptional gene regulation in eukaryotes
Nucleic Acids Research 34: D108-D110 (2006). - J. D. Thompson and D. G. Higgins and T. J. Gibson.
CLUSTALW: improving the sensitivity of progressive multiple sequence alignment
through sequence weighting, position-specific gap penalties and weight matrix choice.,
Nucleic Acids Research,22:4673-4680 (1994). - M. Brudno and B.D. Chuong and G.M. Cooper and M.F. Kim and E. Davydov and E.D. Green and A. Sidow and S. Batzoglou
LAGAN and Multi-LAGAN: efficient tools for large-scale multiple alignment of genomic DNA
Genome Research 13:721-731 (2003). - M. Blanchette and M. Tompa.
FootPrinter: a program designed for phylogenetic footprinting
Nucleic Acids Research 31:3840-3842 (2003).