 PLoS Computational Biology (2006): Transcription Factor Map Alignment of Promoter Regions
| Contents |
- ABSTRACT
- TF-MAP ALIGNMENT ALGORITHM
- MAPPING FUNCTIONS
- THE HR-SET DATASET
- TF_MAP ALIGNMENT TRAINING
- TF-MAP ALIGNMENT OF GENOMIC REGIONS
- TF-MAP ALIGNMENT OF CO-EXPRESSED GENES
- SOFTWARE HOME PAGE
- REFERENCES
| ABSTRACT |
We address the problem of comparing and characterizing the promoter regions of genes with similar expression patterns. This remains a challenging problem in Sequence Analysis, because often the promoter regions of co-expressed genes do not show discernible sequence conservation. In our approach, thus, we have not directly compared the nucleotide sequence of promoters; Instead, we have obtained predictions of Transcriptions Factor Binding Sites (TFBSs), annotated the predicted sites with the labels of the corresponding Binding Factors, and aligned the resulting sequences of Transcription Factor labels--to which we refer here as Transription Factor maps (or TF-maps). To obtain the global pairwise alignment of TF-maps, we have adapted an algorithm initially developed to align restriction enzyme maps. We have optimazed the parameters of the algorithm in an small, but well curated, collection of human-mouse orthologous gene pairs. Results in this data set indicate that TF-map alignments are able to uncover conserved regulatory elements, which can not be detected by the typical sequence alignments. Exhaustive tests using the collection of human co-expressded gens in the CISRED database, further demonstrate that TF-map alignments of promoter regions are able to better discriminate co-regulated from non co-regulated genes than nucleotide sequence alignments.
| TF-MAP ALIGNMENT ALGORITHM |
In our approach, we translate the nucleotide sequence of a promoter region S = s1 s2 ... sk into a sequence of quads A = a1, ... an where each quad ai = (aif, aip1,aip2,ais) denotes the match with score ais of a binding site for the TF aif ocurring between the position aip1 and the position aip2 over the sequence S.
The optimal alignment between two given maps A and B is the one scoring the maximum among all possible aligments. To obtain such an alignment efficiently, we have implemented an algorithm reminiscent of that proposed by Waterman et al. (1984) to align and compare enzyme restriction maps. This algorithm was developed to find the distance between two homologous restriction maps in terms of minimum weighted sum of genetic events necessary to convert one restriction map into another, where the genetic events are the appearance/disappearance of restriction sites and changes in the number of bases between restriction sites.
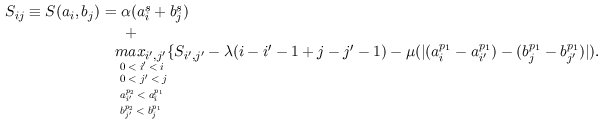
Here to align TF-maps A and B, we adapted such recursion to optimize similarity instead. In addition, we include a term (?) into the scoring function to weigth the scores of the matches to the TFBSs. We also discard those matches that could introduce overlap in the alignment. Thus, the maximum similarity between TF-maps A = a1, ... ai and B = b1, ... bj where the site aif is equal to the site bjf can be computed as:
 |
|
|
That is, the score of the alignment increases with the score of the matches of the aligned elements (?), and decreases with the number of unaligned elements (?), and with the difference in the distance between adjacent aligned elements (?).
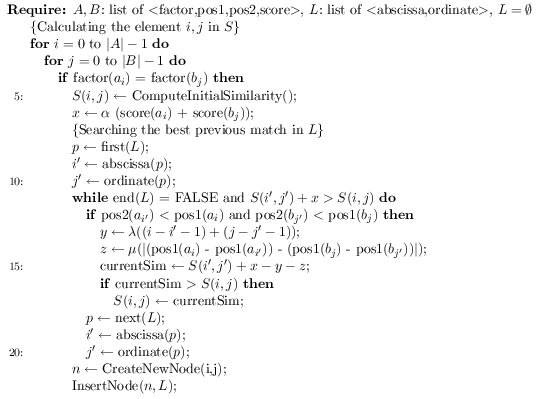
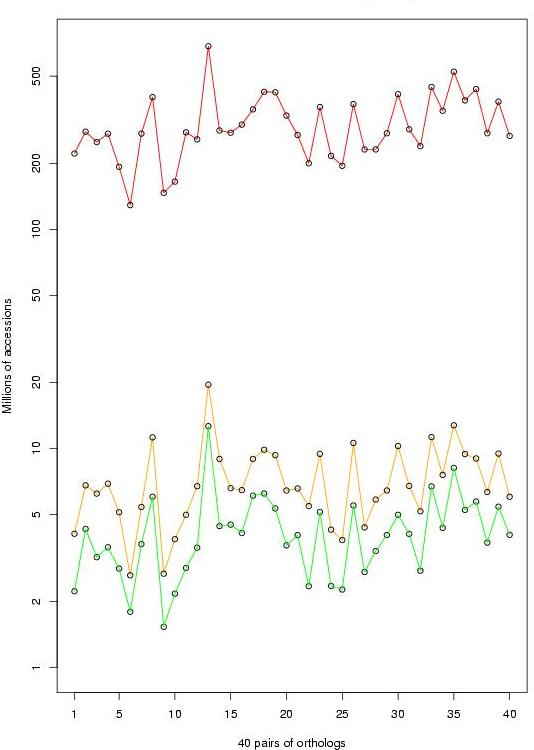
The cost of the naive approach that evaluates all of the cells of the matrix when searching the best previous match for joining to the current one is O(n4). However, we propose to take advantage of the extreme sparsity of the matrix S when aligning TF-maps. In the algorithm below, we substitute the two internal nested loops by a list to register the coordinates of the match cells in the sparse matrix:
 |
|
|
The expected cost of this new approach can approximated to the cost of the naive algorithm divided by the length of the alphabet employed in the mapping (typically, hundreds of elements). The empirical results obtained during the program training confirmed such analysis. In average, on the order of 200 millions of elements were consulted by the naive algorithm during the optimization. In contrast, the enhanced algorithm only needed to access nearly two millions of elements to compute the same set of alignments.
 |
|
| MAPPING FUNCTIONS |
In the work described in this paper, we obtain the translation from a sequence of nucleotides into a map by running on the sequence a collection of position weight matrices (PWMs) representing binding motifs for TFs. For each match over a given threshold, we register the positions, the score, and the label of the TF associated to the PWM. We will refer to the resulting map as a Transcription Factor Map (TF-map).
Four different collections of PWMs have been used in this mapping (likelihood form):
- JASPAR 1.0: 111 matrices [JASPAR database]
- PROMO 2.0: 316 matrices [PROMO database]
- TRANSFAC 6.4: 442 matrices [TRANSFAC database]
- JASPAR 1.0 TOP-50: 50 matrices
This is an example of such matrices:
TBP 1 61 145 152 31 2 16 46 18 309 3 352 0 2 35 4 3 10 2 374 5 354 0 5 30 6 268 0 0 121 7 360 3 10 6 8 222 2 44 121 9 155 44 157 33 10 56 135 150 48 11 83 147 128 31 12 82 127 128 52 13 82 118 128 61 14 68 107 139 75 15 77 101 140 71 |
TBP 1 -0.466 0.399 0.447 -1.143 2 -1.805 -0.749 -1.687 1.156 3 1.286 -5.270 -3.884 -1.022 4 -3.479 -2.275 -3.884 1.347 5 1.292 -5.270 -2.968 -1.176 6 1.014 -5.270 -5.270 0.219 7 1.335 -3.453 -2.249 -2.759 8 0.825 -3.884 -0.793 0.219 9 0.466 -0.793 0.479 -1.081 10 -0.552 0.328 0.433 -0.706 11 -0.158 0.413 0.275 -1.143 12 -0.171 0.267 0.275 -0.626 13 -0.171 0.193 0.275 -0.466 14 -0.358 0.096 0.357 -0.260 15 -0.233 0.038 0.364 -0.315 |
|
|
|
||
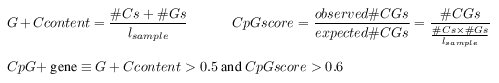
Each row in the frequency matrix M corresponds to the observed distribution of nucleotides in this position of the motif after an aligment of real sites was done. Thus, the element M(x,i) in the matrix is the number of cases in which the nucleotide x was observed at position i. The probability or score to observe such fact is obtained with P(x,i) = M(x,i) / M(A,i) + M(C,i) + M(G,i) + M(T,i).
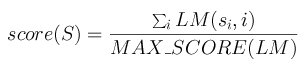
Each element LM(x,i) in the likelihood matrix LM corresponds to the logarithm of the ratio between the probability of observing such a nucleotide in this position in a real site versus the probability of observing it in a false site. False site distribution is modeled with a uniform random distribution (0.25,0.25,0.25,0.25). The maximum score MAX_SCORE of a matrix is the sum of the highest score at each row. The scoring method for a segment S=s1s2...sn with a matrix LM is then:
 |
|
|
MATSCAN
The mapping functions described here are implemented in the program matscan v1.0. MATSCAN searches for occurrences of binding sites or any type of genomic signal that can be defined using weight matrix models. The predictions are displayed in GFF format, being graphically represented with the program gff2ps. The source code of the program is publicly available at the home page of the software implementing the TF-map alignment: [MatScan source code] [Examples]
The program matscan v 1.0 was written by Enrique Blanco and Roderic Guigo.
If you use this program, please cite:
E. Blanco, X. Messeguer, T.F. Smith and R. Guigo.
Transcription Factor Map Alignment of Promoter Regions.
PLoS Computational Biology 2(5): e49 (2006).
| THE HR-SET DATASET |
We have gathered and manually curated a collection of 278 TFBSs (139 + 139 orthologous sites) that had been experimentally tested in 40 orthologous human and rodent genes (ABS, Blanco et al., 2006). Because most (214 out of 278) of the annotated TFBSs are located in the 200 nucleotides inmediately upstream the TSS, we restricted to this region in our training and evaluation analysis, and considered only those cases for which the same pair of TFBSs had been annotated in this region for both species. This resulted in a collection of 202 sites (101 + 101) from 36 genes, to which we refer here as the HR-set.
40 human-mouse gene promoter pairs:
-The 40x2 promoters of the collection of 278 TFBSs (500 bps upstream the TSS)
-The collection of 278 TFBSs
The HR-set (36 human-mouse gene pairs):
-The 36x2 promoters of the collection of the HR-set (200 bps upstream the TSS)
-The HR-set (202 TFBSs, 101 + 101)
MAPPING on the 40x40 promoter sequences:
-JASPAR predictions
-PROMO predictions
-TRANSFAC predictions
-JASPAR TOP-50 predictions
ANNOTATIONS SUPPORTED BY ANY PREDICTION:
-186 annotations supported by JASPAR predictions
-188 annotations supported by PROMO predictions
-188 annotations supported by TRANSFAC predictions
-100 annotations supported by JASPAR TOP-50 predictions
 |
|
| TF-MAP ALIGNMENT TRAINING |
The optimal alignment between two TF-maps is obviously dependendant on the ?, ? and ? parameters. We have estimated the optimal parameters in the HR-set for the JASPAR 1.0, PROMO 2.0 and TRANSFAC 6.3 collections.
OPTIMAL CONFIGURATIONS FOR EACH MAPPING FUNCTION:
-Best configuration using JASPAR
-Best configuration using PROMO
-Best configuration using TRANSFAC
-Best configuration using JASPAR TOP-50
For each configuration, the correctly detected pair of sites on each pair of sequences is denoted with OK. The length and the score of the meta-alignment are also provided. At the end, the accuracy measures at site level, site+label level and nucleotide level are displayed (see main text).
NEGATIVE CONTROL BY SHUFFLING THE HR-set PROMOTERS:
-Original orthology associations (36 genes)
-Associations after shuffling (36 genes)
-Score and length of the 36 shuffled TF-map alignments using JASPAR
-Score and length of the 36 shuffled BLASTN sequence alignments
| TF-MAP ALIGNMENT OF GENOMIC REGIONS |
To assess to what extend good TF-map alignments are a simply reflection of underlying sequence conservation, we have compared the meta-alignments obtained using JASPAR-TOP 50, in the 200 bp promoter region of the 36 gene pairs from the HR-set, with the meta-alignments obtained in 200 bp fragments from intergenic (2000bp upstream of the TSS), 5'UTR (downstream of the TSS), coding (downstream of the translation start site and considering only coding DNA), intronic (downstream of the first intron junction), and downstream (downstream of the transcription termination site). We have computed the average score of the map alignments in each of the genomic regions and have identified for each homologous pair, the genome regions in which the alignment produces the highest score. We have performed the same exercise using global pairwise sequence alignments (obtained with CLUSTALW).
In addition, we have performed the same comparison on the human-chicken orthologous pairs of the HR-set. According to the UCSC genome browser, we found the chicken ortholog in REFSEQ for 25 human genes of the HR-set. Then, we compared again the meta-alignments obtained using JASPAR-TOP 50, in the 200 bp promoter region of the 25 gene pairs from the HC-set, with the meta-alignments obtained in 200 bp fragments from intergenic (2000bp upstream of the TSS), 5'UTR (downstream of the TSS), coding (downstream of the translation start site and considering only coding DNA), intronic (downstream of the first intron junction), and downstream (downstream of the transcription termination site). We also have performed the same exercise using global pairwise sequence alignments (obtained with CLUSTALW).
HR-set:
- The HR-set (36 gene pairs)
- Samples of the human and rodent genomic regions
- TF-map alignment results using JASPAR-TOP 50
- Sequence alignment results using CLUSTALW
HC-set:
- The HC-set (25 gene pairs)
- Samples of the chicken genomic regions
- TF-map alignment results using JASPAR-TOP 50
- Sequence alignment results using CLUSTALW
| TF-MAP ALIGNMENT OF CO-EXPRESSED GENES |
We have performed an exhaustive evaluation of the power of TF-map alignments to characterize promoter regions of co-regulated genes in absence of sequence similarity. Towards such a goal we have used the set of high-confidence coexpressed gene pairs (Griffith et al,2005), obtained from cDNA microarray hybridization, SAGE and other experiments, as well as Gene Ontology analysis included in the CISRED database. Each group is always identified by a representative gene and the set of co-regulated genes with it.
 |
 |
|
|
|
DATA:
- The 5333 CISRED genes with available promoter
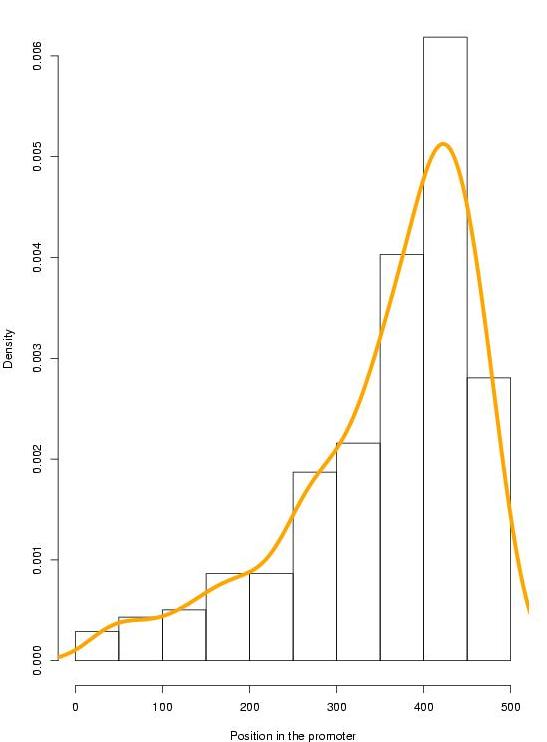
- The promoter sequence of the available 5333 CISRED genes (500 bps)
- The (-100:100) sequence around the TSS annotated by BIOMART of the CISRED genes (200 bps)
- CpG+ and CpG- classification of the CISRED genes: [gene,GC content,CpG score, class]
 |
|
|
TF-MAP alignments:
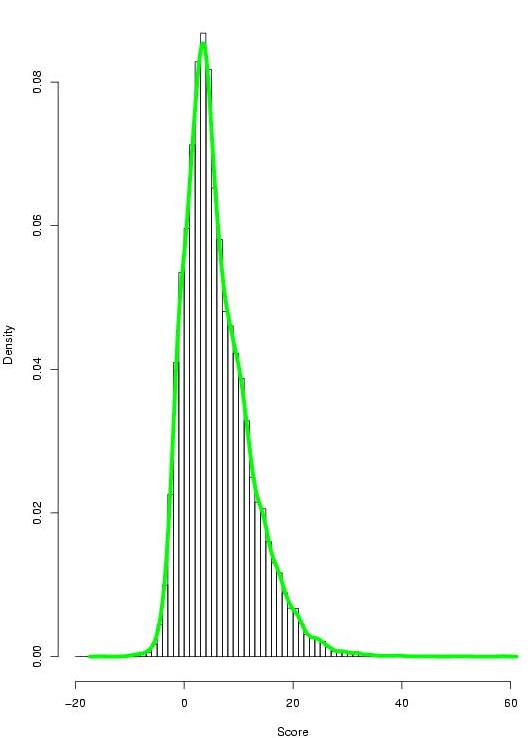
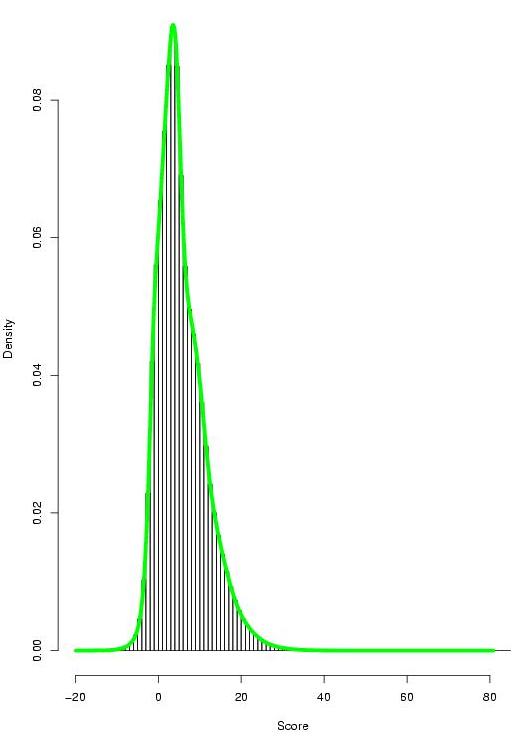
- TF-map alignment results between co-regulated genes (21288x2 alignments, best HSP score reported)
- TF-map alignment results between non co-regulated genes (10300320x2 alignments, best HSP score reported)
- 1240 TF-map alignments between co-regulated genes that are in TOP-445,371 best alignments
- Results of evaluating the significance of TF-map alignments (Wilcoxon test p-value)
- 97 groups with p-value < 0.01 and 23 groups with p-value < 0.001
Discarding the presence of recent duplications in the 97 genes set:
- The 97 gene groups with p-value < 0.01
- 97 x 97 BLASTN promoter alignments: best HSP for each pair (avg. score: 32.14, avg. length: 59.91)
- 97 x 97 NEEDLE (EMBOSS software) promoter alignments (avg. %similarity: 36.97)
BLASTN alignments:
- BLASTN alignments between co-regulated genes (981 alignments, best HSP score reported)
- BLASTN alignments between non co-regulated genes (444390 alignments, best HSP score reported)
- Results of evaluating the significance of BLASTN alignments (653 groups, Wilcoxon test p-value)
* 11 groups with p-value < 0.01 and 1 group with p-value < 0.001
RANKING - Coreg alignments in the TOP-445,371:
- Intersection between the 981 BLASTN alignments and the 1240 TF-map alignments
- Intersection between the 1240 TF-map alignments and the 1072 pairs detected by TF conservation coefficient
TTR promoter reconstruction:
- The 83 TF-map alignments between the TTR gene and a co-regulated gene
- The reconstruction of the TTR promoter using the 83 TF-map alignments
| SOFTWARE HOME PAGE |
The home page of the software implementing the TF-map alignment is at:
TF-MAP ALIGNMENT HOME PAGE
Here you can find:
- The source code of the program
- Benchmarking test
- Examples of the output
The web server that performs the mapping and the TF-map alignment is at:
TF-MAP ALIGNMENT WEB SERVER
The available functions now are:
- Mapping applications to translate a promoter sequence into a TF-map with different collections and thresholds
- Meta-alignment of two TF-maps allowing the user to configure the parameters
- Dummy example
| REFERENCES |
- E. Blanco, X. Messeguer, T.F. Smith and R. Guigó
Transcription Factor Map Alignment of Promoter Regions
PLoS Computational Biology 2(5): e49 (2006).
- E. Blanco, D. Farre, M. Alba, X. Messeguer and R. Guigó
ABS: a database of Annotated regulatory Binding Sites from orthologous promoters.
Nucleic Acids Research 34:D63-D67 (2006).
- E. Blanco, X. Messeguer and R. Guigó
Novel computational methods to characterize regulatory regions.
CSHL - Systems Biology (Poster), New York, USA (2004)
- E. Blanco, X. Messeguer and R. Guigó
Alignment of Promoter Regions by Mapping Nucleotide Sequences into Arrays of Transcription Factor Binding Motifs.
VIIth RECOMB (Poster), Berlin, Germany (2003)
- M.S. Waterman, T. F. Smith and H. L. Katcher
Algorithms for restriction map comparisons,
Nucleic Acids Research, 12:237-242 (1984).
- O.L. Griffith, E.D. Pleasance, D.L. Fulton, M. Oveisi, M. Ester, A.S. Siddiqui and S.J. Jones.
Assessment and integration of publicly available SAGE, cDNA microarray, and oligonucleotide microarray expression data for global coexpression analyses.,
Genomics,86(4):476-488 (2005).