Bioinformatics (2004): Splice site identification by idlBNs
Splice Site Identification by idlBNs
R. Castelo* and R. Guigó
Bioinformatics, 20(1):i69-i76, 2004 [full text]
*To whom correspondence should be adressed.
| Contents |
In this site we provide supplementary information consisting of the datasets specifically built for this work as well as the full set of results.
| Abstract |
Motivation: Computational identification of functional sites in nucleotide sequences is at the core of many algorithms for the analysis of genomic data. This identification is based on the statistical parameters estimated from a training set. Often, because of the huge number of parameters, it is difficult to obtain consistent estimators. To simplify the estimation problem, one imposes independence assumptions between the nucleotides along the site. However, this can potentially limit the minimum value of the estimation error.
Results: In this paper we introduce a novel method, in the context of identifying functional sites, that finds a reasonable set of independence assumptions supported by the data, among the nucleotides, and uses it to perform the identification of the sites by their likelihood ratio. More importantly, in many practical situations it is able to improve its performance as the training sample size increases. We apply the method to the identification of splice sites, and further evaluate its effect within the context of exon, and gene, prediction.
| The data |
In the experiments we have used three different datasets. One is the set of 19,174 human annotations in the reference sequence (RefSeq) dataset (UCSC version hg15) based on NCBI Build 33 (April 10, 2003). The other two are used exclusively for testing purposes and correspond to the Burset and Guigó (1996) dataset of 570 human genes (BG-570), and the Rogic et al. (2001) dataset of 195 genes (HMR-195) including human (103), mouse (82) and rat (10) genes.
These datasets have been further transformed to obtain the training and testing datasets of acceptors and donors (ACCDON), the training datasets of start, stop, acceptor and donor sites (NOBGRORS), and the testing datasets of internal exons from the BG-570 and HMR-195 genes (BGROIEXONS). Below we can find the detailed description of each of them as well as the corresponding data files.
ACCDON datasets
In order to assess splice site identification we have extracted from the RefSeq genes two sets of non-redundant canonical donor and acceptor sites. The non-redundancy has been enforced by selecting unique stretches of DNA containing the donor and the acceptor site, where the donor stretch had 39bp (the first 3bp in the exon) and the acceptor stretch had 23bp. Afterwards, from the donor context we selected 9bp (3bp exon + gt + 4bp intron) to form every donor site. This left a total of 124,727 donor sites, and 130,220 acceptor sites. We created 2 datasets of these same sizes with false (decoy) donor and acceptor sites by sampling uniformly from coding regions, and 2 more datasets by sampling from intronic regions of the RefSeq genes. All the false sites matched the corresponding minimum consensus (gt,ag). Non-redundancy was enforced in the same way as for the true sites. Below we can find the corresponding files:
|
hs.acceptorsnr.dat.gz - zip (1.0M) |
true acceptor sites |
|
hs.falseacceptorsnr.coding.dat.gz - zip (1.1M) |
false acceptor sites sampled from coding regions |
|
hs.falseacceptorsnr.intron.dat.gz - zip (1.1M) |
false acceptor sites sampled from intronic regions |
|
hs.donors39.dat.gz - zip (1.6M) |
true donor sites within a stretch of 39bp |
|
hs.donorsnr.dat.gz - zip (297k) |
subset of the stretch of 39bp forming true donor sites of 3bp exon + gt + 4bp intron |
|
hs.falsedonors39.coding.dat.gz - zip (1.6M) |
false donor sites within a stretch of 39bp sampled from coding regions |
|
hs.falsedonors39.intron.dat.gz - zip (1.7M) |
false donor sites within a stretch of 39bp sampled from intronic regions |
|
hs.falsedonorsnr.coding.dat.gz - zip (407k) |
subset of the stretch of 39bp forming false donor sites of 3bp exon + gt + 4bp intron sampled from coding regions |
|
hs.falsedonorsnr.intron.dat.gz - zip (404k) |
subset of the stretch of 39bp forming false donor sites of 3bp exon + gt + 4bp intron sampled from intronic regions |
The donor and acceptor site prediction has been assesed by carrying out a 10-fold cross-validation along increasing sizes of the training datasets of donor and acceptor sites, starting on 1,000, 5,000 and 10,000, and continuing with sizes that increase in 10,000 sites up to 100,000. The rest of the sites not contained in each training dataset form the test dataset. The 10-fold cross-validation is done by sampling each of the 12 sizes, ten times from the ACCDON datasets, where half of the false sites were sampled from the file with those from coding regions and half from the file with those from intronic ones. This led to 12 x 10 x 4 = 480 datasets that have a total compressed size of about 780Mbytes. Because of such a large size, we do not include the link here, but we can provide the tar ball on request.
NOBGRORS datasets
From the RefSeq data, we have filtered out genes with either the same name, or annotated in a loose chromosome chunk (chr_random), or those that overlap another annotation (leaving one copy arbitrarily chosen). From this latter set, we translated into protein each gene, and discard those that either did not start, and end, with a start, and stop, codons, and those which had in-frame stop codons. This left a total of 14,080 genes.
Further, we obtained the corresponding proteins from the BG-570 and HMR-175 genes and performed BLASTP against the previously filtered RefSeq proteins. These are the files involved:
|
corresponding protein translations from the 14,080 filtered RefSeq genes. |
|
|
bghmr195.aa.fa.gz (115k) |
corresponding protein translations from the 570 + 195 = 765, BG-570 and HMR-195 genes. |
|
BLASTP output from querying the 765 BG-570 and HMR-195 genes, against the 14,080 Refseq genes. |
From the previous BLASTP output, we considered only those HSPs that had an E-value smaller or equal than 10-5 and from these, select those that showed an identity greater than or equal to 60%. There were 855 proteins matching these criteria, and the corresponding genes were removed from the RefSeq genes, leaving a total of 13,225 genes, which form the NOBGRORS dataset from which we extracted the following sets of functional (real and false) sites:
|
hs.acceptors.train.dat.gz (893k) |
acceptor sites |
|
hs.facceptors.train.dat.gz (950k) |
false acceptor sites |
|
hs.donors.train.dat.gz (265k) |
donor sites |
|
hs.fdonors.train.dat.gz (361k) |
false donor sites |
|
hs.starts.train.dat.gz (67k) |
start sites |
|
hs.fstarts.train.dat.gz (69k) |
false start sites |
|
hs.stops.train.dat.gz (63k) |
stop sites |
|
hs.fstops.train.dat.gz (63k) |
false stop sites |
All the false sites are formed by sampling half of them from coding regions and half of them from intronic regions. The entire set of 13,225 genes has a total compressed size of 177Mbytes, for which we do not include a link here but we can provide on request.
BGROIEXONS datasets
From the BG-570 and HMR-195 genes datasets, we extracted all the internal exons (2,110). From each gene with n internal exons, we have randomly sampled the same amount of false exons three times. First, ensuring that both splice sites are false; second, for every true acceptor site, we chose randomly a downstream false donor site; and third, for every true donor site we chose randomly an upstream false acceptor site. These are the resulting datasets:
|
true internal exons |
|
|
false internal exons with both false splice sites |
|
|
false internal exons with a true acceptor site and a false donor site |
|
|
false internal exons with a true donor site and a false acceptor site |
| Results |
We include here the full set of results on splice site, internal exon, and gene, prediction.
Splice site prediction
|
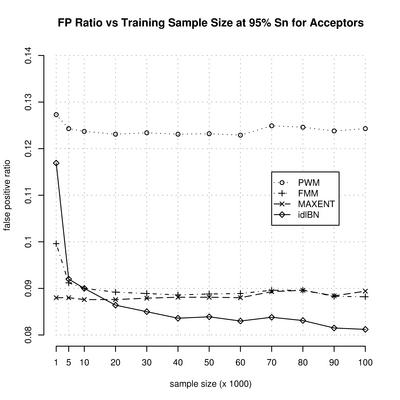
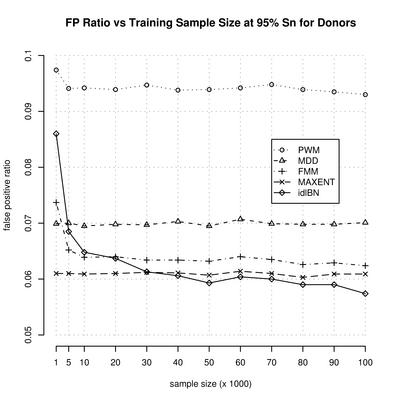
We have performed a 10-fold cross-validation along increasing sizes of the training datasets of donor and acceptor sites, starting on 1,000, 5,000 and 10,000, and continuing with sizes that increase in 10,000 sites up to 100,000. The rest of the sites not contained in each training dataset form the test dataset. The 10-fold cross-validation is done by sampling each of the 12 sizes, ten times from the ACCDON datasets, where half of the false sites belong to coding regions and half to intronic ones. Finally, the results are averaged over the ten samples for each size. |
 |
|
|
On the right we plot the the false positive ratio, at a sensitivity level of 95%, as function of the training sample size. We include the ROC values for each sample size, model (pwm, fmm, idlbn, mdd and maxent), and sentivity value (at intervals of 5%) in two files under each of the following links: |
 |
Internal exon prediction
|
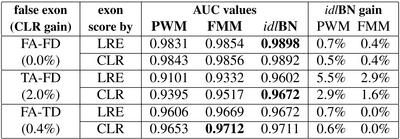
The ROC values for the prediction on the true internal exon dataset combined with each of the three false internal exon datasets (one with both false splice sites, one with a true acceptor 'trueacc', and one with a true donor 'truedon'), are in the file under the following link. This was computed for the three models PWM, FMM and idlBN trained on the NOBGRORS datasets. The first column is the sensitivity, the second is the false positive ratio, and the third is the threshold value on the score that accepts the corresponding sensitivity level. For every ROC curve we computed the Area Under the ROC curve, or AUC, whose values are summarized on the right-hand side table. The AUC values were computed using the pAUCi function from the Bioconductor ROC library. |
 |
Gene prediction
|
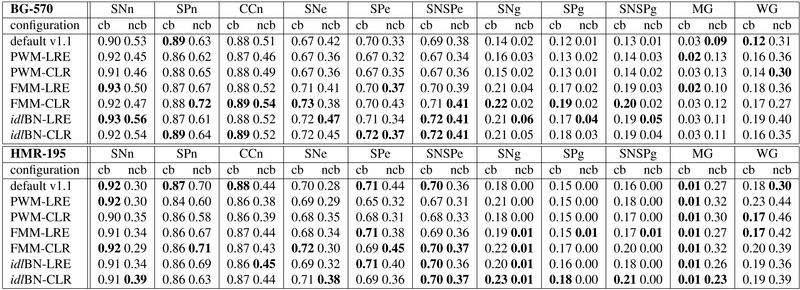
We have assessed gene prediction using the accuracy measures specified on the right table. These are standard measures from the literature (Burset and Guigó, 1996) and we have used them for a collection of experiments on the two genes test datasets, BG-570 and HMR-195. These experiments were carried out for each type of signal model (PWM, FMM, idlBN and the default parameter file of geneid v1.1) and exon scoring scheme (LRE, CLR). For each of those configurations we performed runs covering a wide range of exon weight (EW) values in order to pick the best performance. The best performance was chosen as the one that maximized the correlation coefficient (CCn), sensitivity (SNn) and specificity (SPn) at nucleotide level. These best performances are the ones included and compare in the summary table below. The entire set of results are included in two files under the following links: |
|

| Inclusion-Driven Learned Bayesian Networks (idlBNs) |
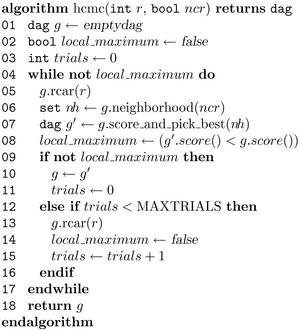
We denote by inclusion-driven learned Bayesian networks (idlBNs) those Bayesian networks whose structure is learned by an inclusion-driven algorithm. We have used the HCMC algorithm, introduced by Castelo and Kocka (2003).
|
|
The HCMC algorithm is stochastic and can output different results in different runs. With a sufficient number of runs one obtains the correct Bayesian network structure when the data is sampled from a DAG-distribution. Analogously, it has two parameters, the RCAR value and the NCR flag, that are also related to its stochastic nature. The optimal values for these parameters depend on how sparse the data are. These parameters, and the entire algorithm are explained in detail in the corresponding article by Castelo and Kocka (2003, Fig. 6, pages 545-548). On the left we show the HCMC algorithm reproduced from the cited article. In the case of the ACCDON datasets where we evaluate the identification of acceptor and donor sites by idlBNs and a 10-fold cross-validation, we have run HCMC 10 times, used a value of RCAR of 15, and set the NCR flag to the truth value. Among the 10 runs we picked the model with the highest score. This was done for each of the four training sets forming the true donor and acceptor sites, and false donor and acceptor sites, each of the 12 training sizes and each of the 10 cross-validated samples. Thus in total, for each of the 12 x 10 x 4 = 480 datasets. In the case of the NOBGRORS datasets, on each model learned for the corresponding functional site (start, stop, donor, acceptor) we have run HCMC 30 times, and picked the learned model with the highest score. In all runs the value of RCAR was 15 and the NCR flag was true. |